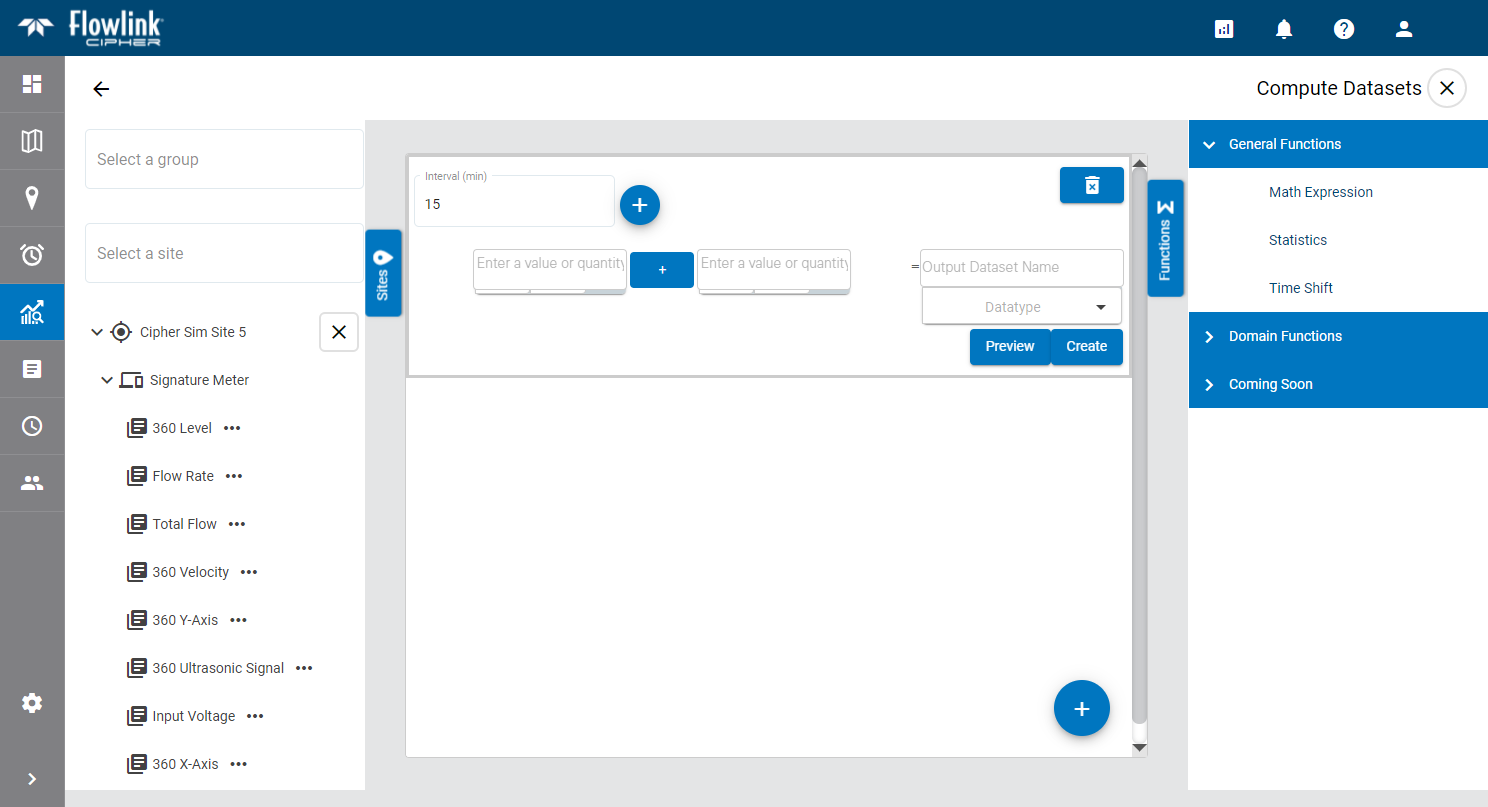
The Compute Datasets screen is used to create a dataset using the data from existing ingested datasets. This dataset can then be used in a graph or to compute additional datasets. For example, to create an I&I dataset, you must first create a Dry Flow dataset.
The functions available for creating a dataset are listed on the right side of the page in the Functions panel, which can be expanded or collapsed using the Functions button.
Different functions are provided for different tasks.
• The General Functions group contains multiple functions that can be used to compute a dataset by applying a type of mathematical calculation to an existing dataset.
• The Domain Functions group contains functions that are specific to certain tasks, such as dry flow calculation and I&I calculation.
• The Flow Rate Calculations group contains functions that are specific to calculating flow rate for using different methods for different devices.
Math Expression
To compute a dataset using the Math Expression function:
1. Using the left mouse button, click and drag the Math Expression function into the middle of the page.
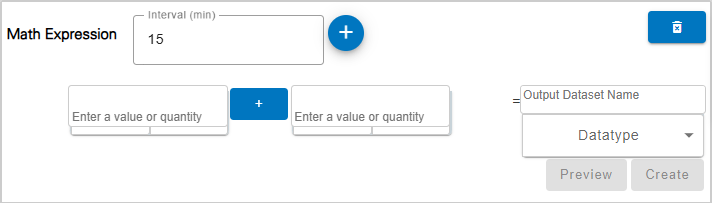
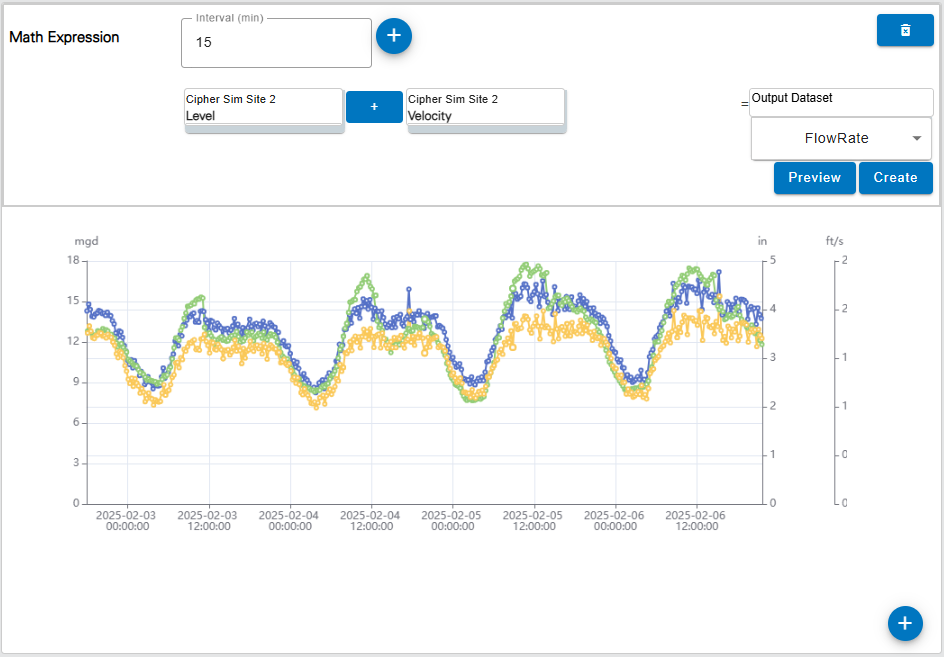
The Interval (min) field is used to specify the frequency with which points will be created in the computed dataset, measured in minutes. The default interval is 15 minutes.
2. Enter a value in the Interval (min) field.
The Enter a value or quantity fields are used to build the math expression. These fields can be populated with the dataset(s) to be included in the expression, or with a constant value to be applied to the datasets. The Add term button  can be used to add additional value fields, allowing multiple datasets to be included in the expression.
3. [Optional] Click Add term to add fields, if needed.
 Datasets are populated in the value fields by selecting the dataset from the Sites panel on the left of the page. Like the Functions list, the panel can be collapsed, using the Sites button, once datasets have been selected.
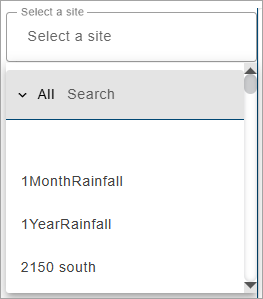
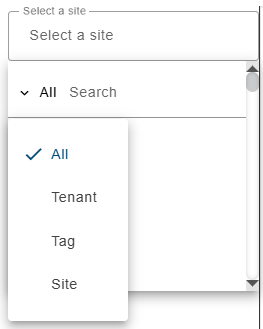
The Select Site field is populated with all available sites in the instance.
4. Click in the Select Site field to expand the field.
If the user has been assigned to a tenant, the list will only contain the sites in that tenant. Similarly, if Preferred Tags have been specified in the Preferences tab of the current user profile, the list will display a "Tags applied" indicator and only sites assigned those tags will be included in the list. If the "Show inactive sites..." option has not been enabled in the Preferences tab, only active sites will be available. See Preferences for more information on these options.
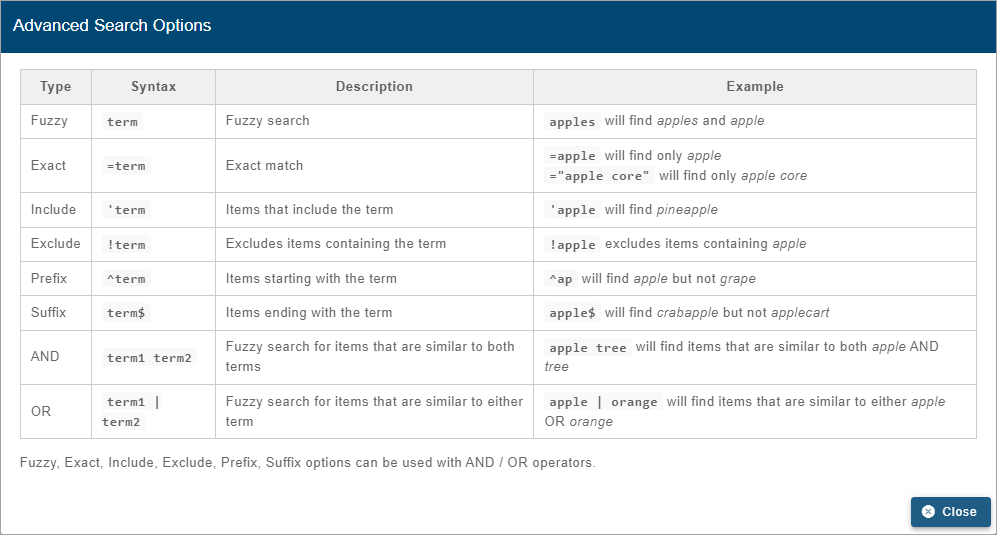
The list of sites can be filtered by specifying text in the Search field at the top of the list. Only sites that match the text specified will be included in the list. Advanced Search characters can also be specified with the text to perform different types of searches, some more specific, some more general. Clicking the Advanced Search Options link below the Search field will display a chart of the possible search types and how to use them. The AND/OR operators can also be used in combination with the other Advanced Search options if needed.
A drop-down list beside the Search field can be used to filter the list even further by specifying the property in which to search for the matching text. Also, when a property is selected from the drop-down list, clicking in the Search field will display a drop-down list of possible values based on the selected property, allowing a value to be selected instead of entering it manually. When an option is selected, only sites with text in the selected property (tenant, tag, etc.) will be available.
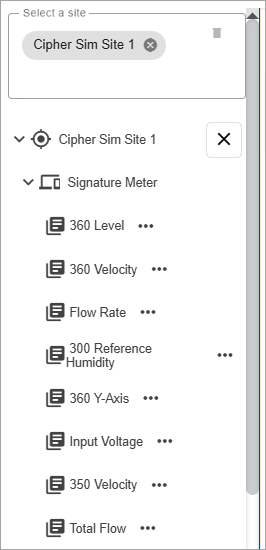
5. Select a site from the list.
All ingested datasets and computed datasets available for the selected site will be displayed in a drop-down list. Additional sites can be selected to display more datasets if needed.
6. [Optional] Select additional sites as needed.
7. Expand the datasets drop-down lists to view the available datasets.
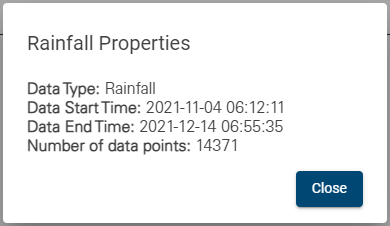
The Properties button (...) beside each dataset in the list displays a dialog box containing information about the dataset.
8. Click a dataset in the list, keeping the mouse button pressed, and drag it into the relevant quantity field.
9. Select a mathematical operator for the expression by clicking the operator button between each field and selecting from the options displayed.
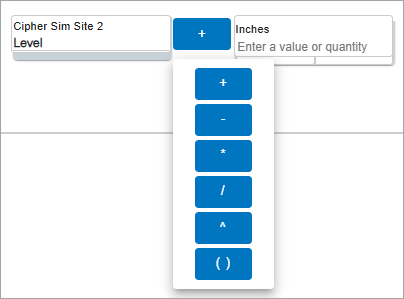
10. If using a constant value, enter the value in the value field.
The data type and unit of measure for the constant value are automatically selected based on the dataset in the expression. The unit of measure is displayed at the top of the value field. If the addition or subtraction operators are being used, hovering the cursor over the value field displays controls that can be used to change these settings if needed.
The Output Datatype field is used to specify the data type for the resulting dataset. This is only needed if the expression will result in output data with a type that differs from the input data. For example, if using level and velocity datasets to calculate flow rate.
11. Select the output data type.
12. Type a name for the new dataset in the Output Dataset Name field.
Dataset names must be unique in the Cipher database. If an Output Dataset Name is entered that has already been used in any site in the Cipher instance, an error message will be displayed stating that the output name is already in use. Note that dataset names are not case sensitive, therefore "flowrate" is the same as "Flowrate" and "FlowRate". |
The Preview button can be used to view the resulting dataset in a sample graph below the expression fields. Like a regular graph, the mouse can be used to pan and zoom the data in the preview, and moving the cursor around the graph will display a tooltip populated with the data values at the cursor’s location.
The Date range fields are used to specify the range of data to include in the preview based on a time period. Specifying a date range reduces the amount of data being processed and reduces the processing time to generate the preview. The options include:
• Relative: This option will create a preview of the dataset where the end of the range is "now" and the start of the range is a set number of hours, days, weeks, or months previously from "now". A custom option is also available that can be used to specify the number of hours, days, weeks or months to include in the range.
• Static: This option will create a preview of the dataset using data from a specific start and end date.
13. Select the Date range settings for the preview of the dataset.
14. Click Preview.
15. Click Save to create the dataset.
Statistics
The Statistics function can be used to calculate statistics for the data in an existing dataset and output the statistical values to a new computed dataset. Statistical values can be calculated for:
• Average: the sum of the values divided by the number of values within the interval
• Minimum: the lowest value within the interval
• Maximum: the largest value within the interval
• Sum: the total of all values within the interval
• Standard Deviation: the amount of variation or dispersion in the values within the interval from the Average
• Count: the number of values within the interval
To compute a dataset using the Statistics function:
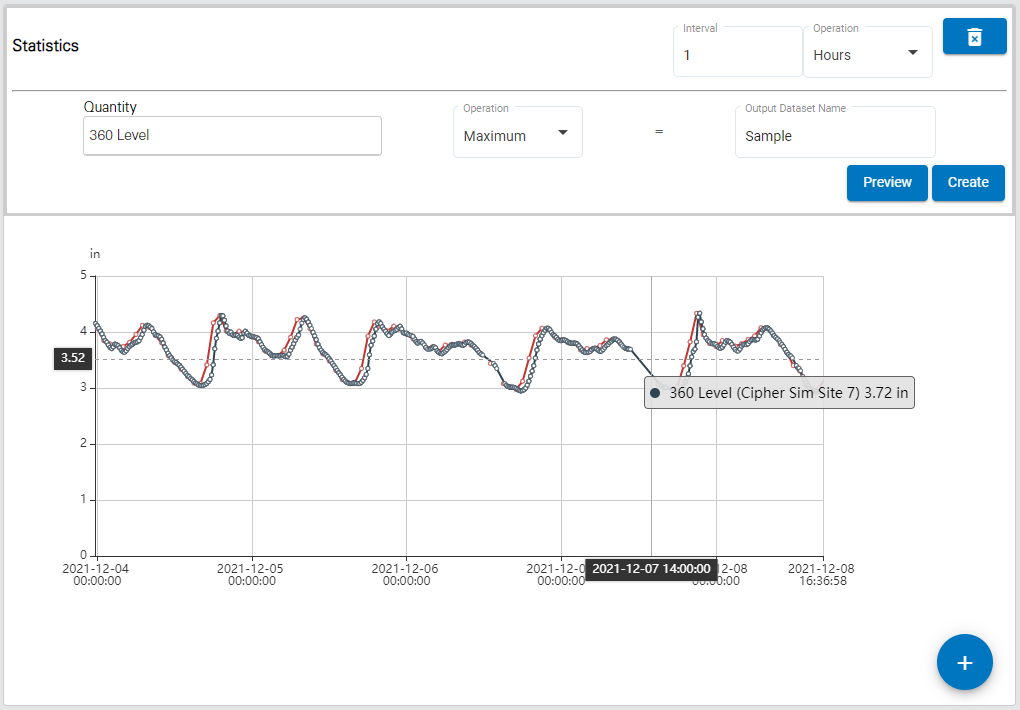
1. Using the left mouse button, click and drag the Statistics function into the middle of the page.
![]()
The Quantity field is populated with the dataset for which you want to calculate statistics; this will be the input data. This field is populated by selecting a dataset from the Sites panel on the left of the page. Like the Functions list, the panel can be collapsed, using the Sites button, once datasets have been selected.
The Select Site field is populated with all sites in the instance.
2. Click in the Select Site field to expand the field.
If the user has been assigned to a tenant, the list will only contain the sites in that tenant. Similarly, if Preferred Tags have been specified in the Preferences tab of the current user profile, the list will display a "Tags applied" indicator and only sites assigned those tags will be included in the list. If the "Show inactive sites..." option has not been enabled in the Preferences tab, only active sites will be available. See Preferences for more information on these options.
The list of sites can be filtered by specifying text in the Search field at the top of the list. Only sites that match the text specified will be included in the list. Advanced Search characters can also be specified with the text to perform different types of searches, some more specific, some more general. Clicking the Advanced Search Options link below the Search field will display a chart of the possible search types and how to use them. The AND/OR operators can also be used in combination with the other Advanced Search options if needed.
A drop-down list beside the Search field can be used to filter the list even further by specifying the property in which to search for the matching text. Also, when a property is selected from the drop-down list, clicking in the Search field will display a drop-down list of possible values based on the selected property, allowing a value to be selected instead of entering it manually. When an option is selected, only sites with text in the selected property (tenant, tag, etc.) will be available.
3. Select a site from the list.
All ingested datasets and computed datasets available for the selected site will be displayed in a drop-down list. Additional sites can be selected to display more datasets if needed.
4. [Optional] Select additional sites as needed.
5. Expand the datasets drop-down lists to view the available datasets.
The Properties button (...) beside each dataset in the list displays a dialog box containing information about the dataset.
6. Click a dataset in the list, keeping the mouse button pressed, and drag it into the Quantity field.
The Interval, Period and Operation fields are used to define the binning for the statistics calculations. The computed dataset will contain a single computed value for each interval based on the data type of the selected input data. For example, if the interval is 1 Minutes, the selected statistic will be computed from the points available for each minute in the data range, populating the dataset with a single statistical value for each minute. The possible interval sizes are Minutes, Hours, Days and Weeks. If the Period value is set to either Days or Weeks, additional fields are displayed to specify the start of day and start of the week to use when the statistics are calculated.
7. Select the Operation for the type of statistics to be calculated.
8. Specify the Interval and Period for the bin sizes in the computed dataset.
9. If necessary, specify the Start of the week and/or Start of the day.
10. Type a name for the new dataset in the Output Dataset Name field.
Dataset names must be unique in the Cipher database. If an Output Dataset Name is entered that has already been used in any site in the Cipher instance, an error message will be displayed stating that the output name is already in use. Note that dataset names are not case sensitive, therefore "flowrate" is the same as "Flowrate" and "FlowRate". |
The Preview button can be used to view the resulting dataset in a sample graph below the expression fields. Like a regular graph, the mouse can be used to pan and zoom the data in the preview, and moving the cursor around the graph will display a tooltip populated with the data values at the cursor’s location.
The Date range fields are used to specify the range of data to include in the preview based on a time period. Specifying a date range reduces the amount of data being processed and reduces the processing time to generate the preview. The options include:
• Relative: This option will create a preview of the dataset where the end of the range is "now" and the start of the range is a set number of hours, days, weeks, or months previously from "now". A custom option is also available that can be used to specify the number of hours, days, weeks or months to include in the range.
• Static: This option will create a preview of the dataset using data from a specific start and end date.
11. Select the Date range settings for the preview of the dataset.
12. Click Preview.
13. Click Save to create the dataset.
Time Shift
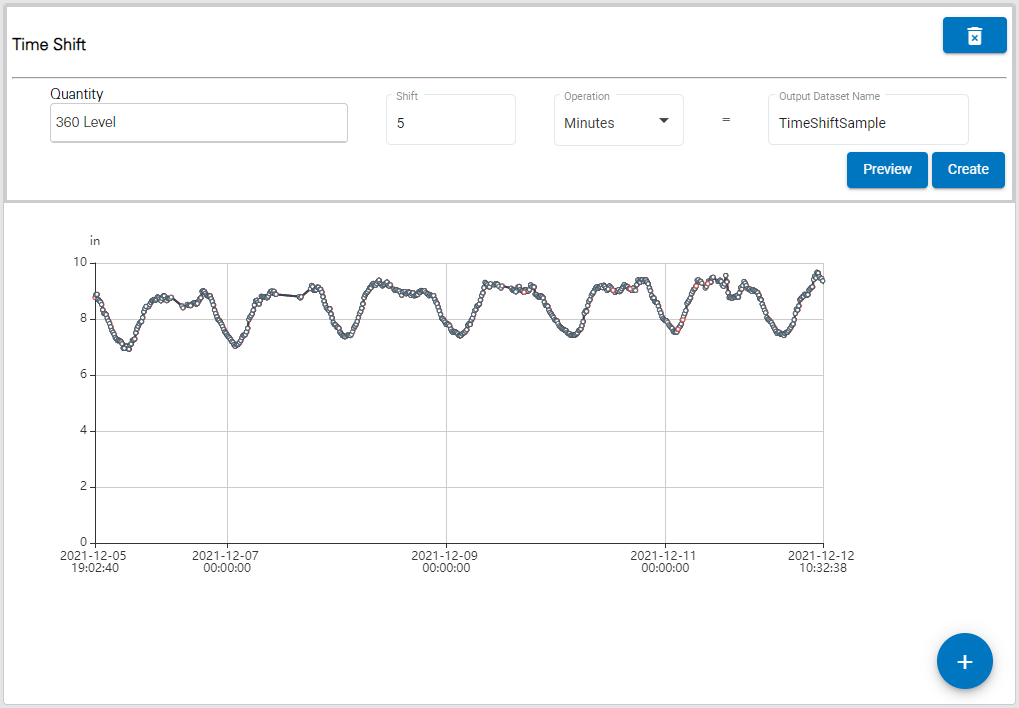
The Time Shift function computes a new dataset for a site by shifting an existing dataset forwards or backwards in time by a specified amount. The data can be shifted by Seconds, Minutes, Hours, Days, Weeks, Months or Years. Shifts using the Month operator are calculated based on 30 days; if the month contains more or less than 30 days, the calculation needs to be adjusted accordingly. Similarly, the Year operator is calculated using 365 days, the calculation needs to be adjusted accordingly if this is not appropriate for the data range.
To compute a dataset using the Time Shift function:
1. Using the left mouse button, click and drag the Time Shift function into the middle of the page.
![]()
The Quantity field is populated with the dataset for which you want to apply a time shift; this will be the input data. This field is populated by selecting a dataset from the Sites panel on the left of the page. Like the Functions list, the panel can also be collapsed, using the Sites button, once a dataset has been selected.
The Select Site field is populated with all sites in the instance.
2. Click in the Select Site field to expand the field.
If the user has been assigned to a tenant, the list will only contain the sites in that tenant. Similarly, if Preferred Tags have been specified in the Preferences tab of the current user profile, the list will display a "Tags applied" indicator and only sites assigned those tags will be included in the list. If the "Show inactive sites..." option has not been enabled in the Preferences tab, only active sites will be available. See Preferences for more information on these options.
The list of sites can be filtered by specifying text in the Search field at the top of the list. Only sites that match the text specified will be included in the list. Advanced Search characters can also be specified with the text to perform different types of searches, some more specific, some more general. Clicking the Advanced Search Options link below the Search field will display a chart of the possible search types and how to use them. The AND/OR operators can also be used in combination with the other Advanced Search options if needed.
A drop-down list beside the Search field can be used to filter the list even further by specifying the property in which to search for the matching text. Also, when a property is selected from the drop-down list, clicking in the Search field will display a drop-down list of possible values based on the selected property, allowing a value to be selected instead of entering it manually. When an option is selected, only sites with text in the selected property (tenant, tag, etc.) will be available.
3. Select a site from the list.
All ingested datasets and computed datasets available for the selected site will be displayed in a drop-down list. Additional sites can be selected to display more datasets if needed.
4. [Optional] Select additional sites as needed.
5. Expand the datasets drop-down lists to view the available datasets.
The Properties button (...) beside each dataset in the list displays a dialog box containing information about the dataset.
6. Click a dataset in the list, keeping the mouse button pressed, and drag it into the Quantity field.
7. Type a shift value in the Shift field. To shift the data backwards, include a negative symbol with the value (e.g. -5).
8. Select an Operation for the type of shift to be calculated.
9. Type a name for the new dataset in the Output Dataset Name field.
Dataset names must be unique in the Cipher database. If an Output Dataset Name is entered that has already been used in any site in the Cipher instance, an error message will be displayed stating that the output name is already in use. Note that dataset names are not case sensitive, therefore "flowrate" is the same as "Flowrate" and "FlowRate". |
The Preview button can be used to view the resulting dataset in a sample graph below the expression fields. Like a regular graph, the mouse can be used to pan and zoom the data in the preview, and moving the cursor around the graph will display a tooltip populated with the data values at the cursor’s location.
The Date range fields are used to specify the range of data to include in the preview based on a time period. Specifying a date range reduces the amount of data being processed and reduces the processing time to generate the preview. The options include:
• Relative: This option will create a preview of the dataset where the end of the range is "now" and the start of the range is a set number of hours, days, weeks, or months previously from "now". A custom option is also available that can be used to specify the number of hours, days, weeks or months to include in the range.
• Static: This option will create a preview of the dataset using data from a specific start and end date.
10. Select the Date range settings for the preview of the dataset.
11. Click Preview.
12. Click Save to create the dataset.
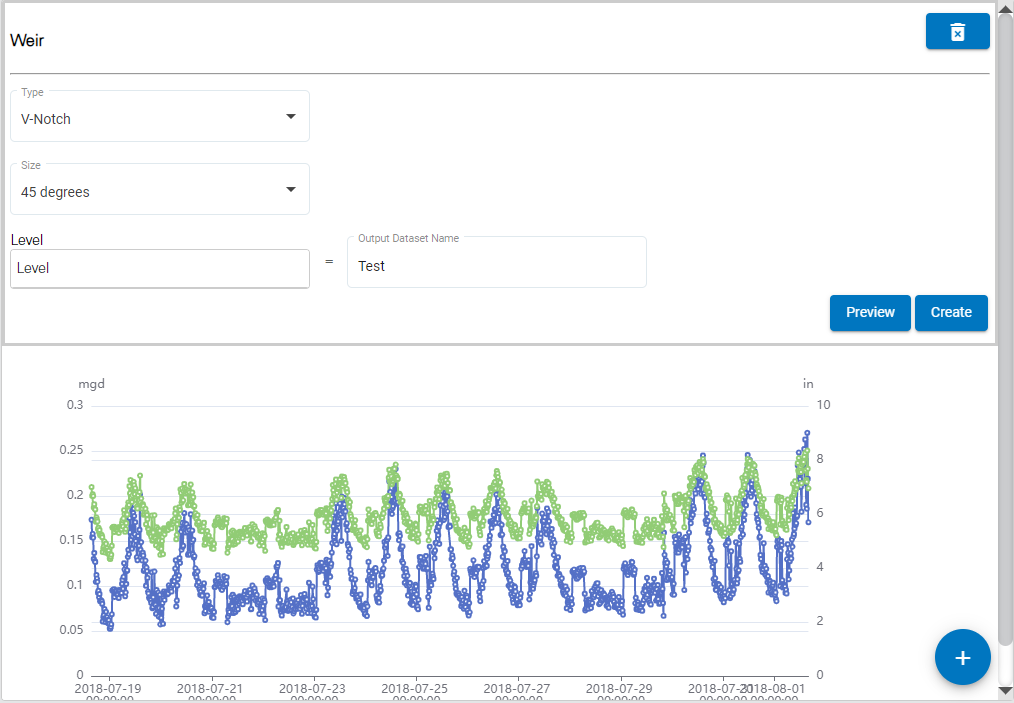
Weir
The Weir function is used to create a flow rate dataset from data passing through a weir device at a monitoring site. The calculation uses the weir type and size along with an existing level dataset. The available types include:
• V-Notch
• Rectangular with End Contractions
• Rectangular without End Contractions
• Cipoletti
• Thel-Mar
To compute a flow rate dataset using the Weir function:
1. Using the left mouse button, click and drag the Weir function into the middle of the page.

2. Select a Type from the drop-down list.
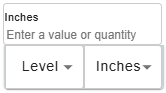
The Size field will differ depending on the weir type selected. For rectangular or Cipoletti types, a crest length must be entered in inches. For v-notch and Thel-Mar types, predefined size values for each type are populated in a drop-down list.
3. Select or enter a Size for the weir.
The Level field is populated with the dataset for which you want to create a flow rate dataset; this will be the input data. This field is populated by selecting a dataset from the Sites panel on the left of the page. Like the Functions list, the panel can also be collapsed, using the Sites button, once a dataset has been selected.
The Select Site field is populated with all sites in the instance.
4. Click in the Select Site field to expand the field.
If the user has been assigned to a tenant, the list will only contain the sites in that tenant. Similarly, if Preferred Tags have been specified in the Preferences tab of the current user profile, the list will display a "Tags applied" indicator and only sites assigned those tags will be included in the list. If the "Show inactive sites..." option has not been enabled in the Preferences tab, only active sites will be available. See Preferences for more information on these options.
The list of sites can be filtered by specifying text in the Search field at the top of the list. Only sites that match the text specified will be included in the list. Advanced Search characters can also be specified with the text to perform different types of searches, some more specific, some more general. Clicking the Advanced Search Options link below the Search field will display a chart of the possible search types and how to use them. The AND/OR operators can also be used in combination with the other Advanced Search options if needed.
A drop-down list beside the Search field can be used to filter the list even further by specifying the property in which to search for the matching text. Also, when a property is selected from the drop-down list, clicking in the Search field will display a drop-down list of possible values based on the selected property, allowing a value to be selected instead of entering it manually. When an option is selected, only sites with text in the selected property (tenant, tag, etc.) will be available.
5. Select a site from the list.
All ingested datasets and computed datasets available for the selected site will be displayed in a drop-down list. Additional sites can be selected to display more datasets if needed.
6. [Optional] Select additional sites as needed.
7. Expand the datasets drop-down lists to view the available datasets.
The Properties button (...) beside each dataset in the list displays a dialog box containing information about the dataset.
8. Click a Level dataset in the list and, keeping the mouse button pressed, drag it into the Level field.
9. Type a name for the new dataset in the Output Dataset Name field.
Dataset names must be unique in the Cipher database. If an Output Dataset Name is entered that has already been used in any site in the Cipher instance, an error message will be displayed stating that the output name is already in use. Note that dataset names are not case sensitive, therefore "flowrate" is the same as "Flowrate" and "FlowRate". |
The Preview button can be used to view the resulting dataset in a sample graph below the expression fields. Like a regular graph, the mouse can be used to pan and zoom the data in the preview, and moving the cursor around the graph will display a tooltip populated with the data values at the cursor’s location.
The Date range fields are used to specify the range of data to include in the preview based on a time period. Specifying a date range reduces the amount of data being processed and reduces the processing time to generate the preview. The options include:
• Relative: This option will create a preview of the dataset where the end of the range is "now" and the start of the range is a set number of hours, days, weeks, or months previously from "now". A custom option is also available that can be used to specify the number of hours, days, weeks or months to include in the range.
• Static: This option will create a preview of the dataset using data from a specific start and end date.
10. Select the Date range settings for the preview of the dataset.
11. Click Preview.
12. Click Save to create the dataset.
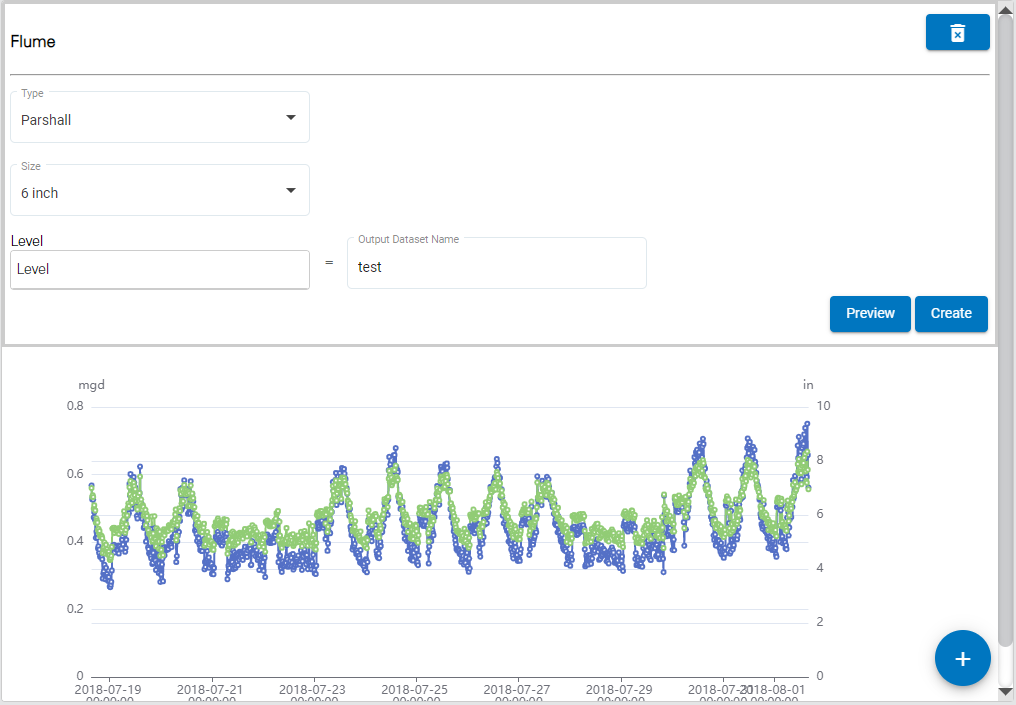
Flume
The Flume function is used to create a flow rate dataset from data passing through a flume device at a monitoring site. The calculation uses the flume type and size along with an existing Level dataset. The available types include:
• Parshall
• Palmer-Bowlus
• Leopold-Lagco
• H
• HS
• HL
• Trapezoidal
To compute a flow rate dataset using the Flume function:
1. Using the left mouse button, click and drag the Flume function into the middle of the page.
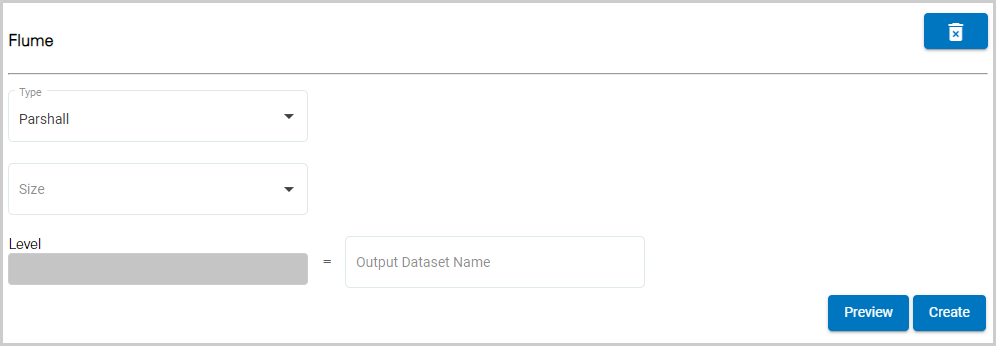
2. Select a Type from the drop-down list.
The Size field is populated with predefined size values specific to each flume type. The values available in the list will change when a different type is selected.
3. Select a Size for the flume.
The Level field is populated with the dataset for which you want to create a flow rate dataset; this will be the input data. This field is populated by selecting a dataset from the Sites panel on the left of the page. Like the Functions list, the panel can also be collapsed, using the Sites button, once a dataset has been selected.
The Select Site field is populated with all sites in the instance.
4. Click in the Select Site field to expand the field.
If the user has been assigned to a tenant, the list will only contain the sites in that tenant. Similarly, if Preferred Tags have been specified in the Preferences tab of the current user profile, the list will display a "Tags applied" indicator and only sites assigned those tags will be included in the list. If the "Show inactive sites..." option has not been enabled in the Preferences tab, only active sites will be available. See Preferences for more information on these options.
The list of sites can be filtered by specifying text in the Search field at the top of the list. Only sites that match the text specified will be included in the list. Advanced Search characters can also be specified with the text to perform different types of searches, some more specific, some more general. Clicking the Advanced Search Options link below the Search field will display a chart of the possible search types and how to use them. The AND/OR operators can also be used in combination with the other Advanced Search options if needed.
A drop-down list beside the Search field can be used to filter the list even further by specifying the property in which to search for the matching text. Also, when a property is selected from the drop-down list, clicking in the Search field will display a drop-down list of possible values based on the selected property, allowing a value to be selected instead of entering it manually. When an option is selected, only sites with text in the selected property (tenant, tag, etc.) will be available.
5. Select a site from the list.
All ingested datasets and computed datasets available for the selected site will be displayed in a drop-down list. Additional sites can be selected to display more datasets if needed.
6. [Optional] Select additional sites as needed.
7. Expand the datasets drop-down lists to view the available datasets.
The Properties button (...) beside each dataset in the list displays a dialog box containing information about the dataset.
8. Click a Level dataset in the list and, keeping the mouse button pressed, drag it into the Level field.
9. Type a name for the new dataset in the Output Dataset Name field.
Dataset names must be unique in the Cipher database. If an Output Dataset Name is entered that has already been used in any site in the Cipher instance, an error message will be displayed stating that the output name is already in use. Note that dataset names are not case sensitive, therefore "flowrate" is the same as "Flowrate" and "FlowRate". |
The Preview button can be used to view the resulting dataset in a sample graph below the expression fields. Like a regular graph, the mouse can be used to pan and zoom the data in the preview, and moving the cursor around the graph will display a tooltip populated with the data values at the cursor’s location.
The Date range fields are used to specify the range of data to include in the preview based on a time period. Specifying a date range reduces the amount of data being processed and reduces the processing time to generate the preview. The options include:
• Relative: This option will create a preview of the dataset where the end of the range is "now" and the start of the range is a set number of hours, days, weeks, or months previously from "now". A custom option is also available that can be used to specify the number of hours, days, weeks or months to include in the range.
• Static: This option will create a preview of the dataset using data from a specific start and end date.
10. Select the Date range settings for the preview of the dataset.
11. Click Preview.
12. Click Save to create the dataset.
Flow Metering Insert
The Flow Metering Insert function is used to create a flow rate dataset from data passing through a flow metering insert device at a monitoring site. The calculation uses the insert type and size along with an existing level dataset. The available types include:
• V-Notch
• Round Orifice
To compute a flow rate dataset using the Flow Metering Insert function:
1. Using the left mouse button, click and drag the Flow Metering Insert function into the middle of the page.
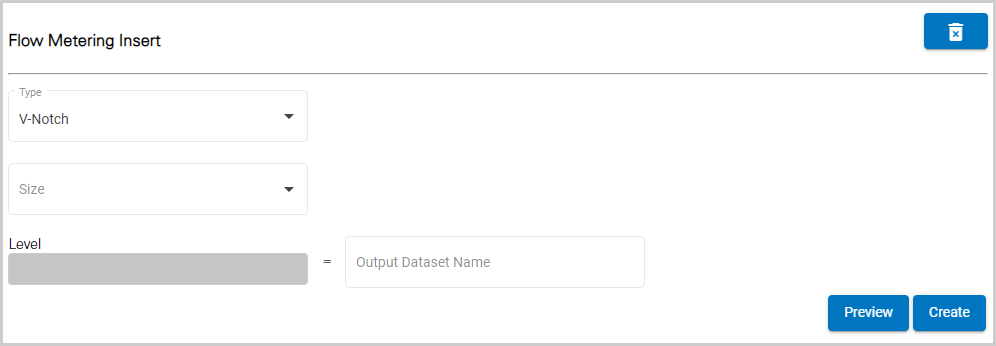
2. Select a Type from the drop-down list.
The Size field is populated with predefined values of 6 to 12 inches.
3. Select a Size for the insert device.
The Level field is populated with the dataset for which you want to create a flow rate dataset; this will be the input data. This field is populated by selecting a dataset from the Sites panel on the left of the page. Like the Functions list, the panel can also be collapsed, using the Sites button, once a dataset has been selected.
The Select Site field is populated with all sites in the instance.
4. Click in the Select Site field to expand the field.
If the user has been assigned to a tenant, the list will only contain the sites in that tenant. Similarly, if Preferred Tags have been specified in the Preferences tab of the current user profile, the list will display a "Tags applied" indicator and only sites assigned those tags will be included in the list. If the "Show inactive sites..." option has not been enabled in the Preferences tab, only active sites will be available. See Preferences for more information on these options.
The list of sites can be filtered by specifying text in the Search field at the top of the list. Only sites that match the text specified will be included in the list. Advanced Search characters can also be specified with the text to perform different types of searches, some more specific, some more general. Clicking the Advanced Search Options link below the Search field will display a chart of the possible search types and how to use them. The AND/OR operators can also be used in combination with the other Advanced Search options if needed.
A drop-down list beside the Search field can be used to filter the list even further by specifying the property in which to search for the matching text. Also, when a property is selected from the drop-down list, clicking in the Search field will display a drop-down list of possible values based on the selected property, allowing a value to be selected instead of entering it manually. When an option is selected, only sites with text in the selected property (tenant, tag, etc.) will be available.
5. Select a site from the list.
All ingested datasets and computed datasets available for the selected site will be displayed in a drop-down list. Additional sites can be selected to display more datasets if needed.
6. [Optional] Select additional sites as needed.
7. Expand the datasets drop-down lists to view the available datasets.
The Properties button (...) beside each dataset in the list displays a dialog box containing information about the dataset.
8. Click a Level dataset in the list and, keeping the mouse button pressed, drag it into the Level field.
9. Type a name for the new dataset in the Output Dataset Name field.
Dataset names must be unique in the Cipher database. If an Output Dataset Name is entered that has already been used in any site in the Cipher instance, an error message will be displayed stating that the output name is already in use. Note that dataset names are not case sensitive, therefore "flowrate" is the same as "Flowrate" and "FlowRate". |
The Preview button can be used to view the resulting dataset in a sample graph below the expression fields. Like a regular graph, the mouse can be used to pan and zoom the data in the preview, and moving the cursor around the graph will display a tooltip populated with the data values at the cursor’s location.
The Date range fields are used to specify the range of data to include in the preview based on a time period. Specifying a date range reduces the amount of data being processed and reduces the processing time to generate the preview. The options include:
• Relative: This option will create a preview of the dataset where the end of the range is "now" and the start of the range is a set number of hours, days, weeks, or months previously from "now". A custom option is also available that can be used to specify the number of hours, days, weeks or months to include in the range.
• Static: This option will create a preview of the dataset using data from a specific start and end date.
10. Select the Date range settings for the preview of the dataset.
11. Click Preview.

12. Click Save to create the dataset.
Manning Formula
The Manning Formula function is used to create a flow rate dataset using the Manning formula. To perform the calculation, details about the type, size, slope and roughness of the channel must be specified. The available channel types include:
• Round: For this type, the diameter of the channel must be specified along with the slope angle and the roughness value.
• U Shaped: For this type, the width of the channel must be specified along with the slope angle and the roughness value.
• Rectangular: For this type, the width of the channel must be specified along with the slope angle and the roughness value.
• Trapezoidal: For this type, the width of the channel at both the top and the bottom must be specified along with the slope angle, roughness value and maximum water level (in inches) for the channel.
To compute a flow rate dataset using the Manning Formula function:
1. Using the left mouse button, click and drag the Manning Formula function into the middle of the page.
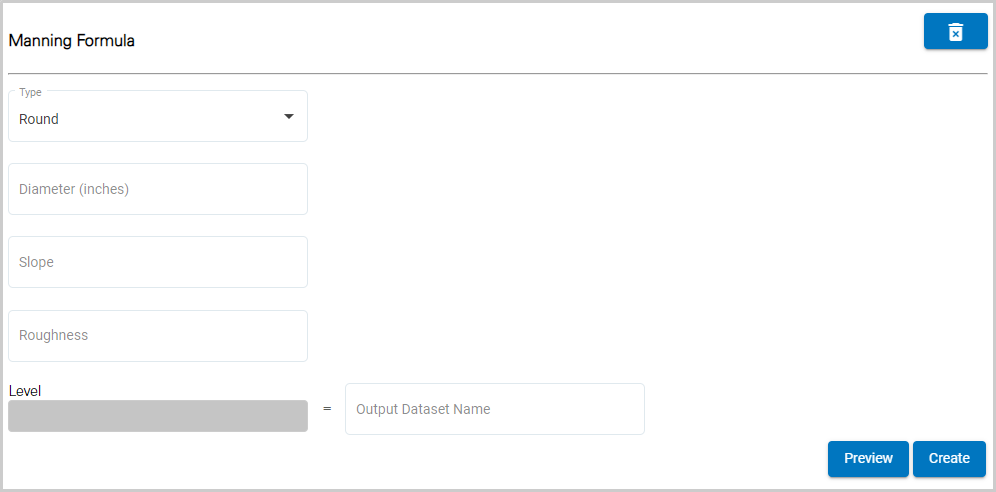
2. Select a Type from the drop-down list.
3. Depending on the type selected enter either a Diameter or Width(s) value for the channel.
4. Enter the Slope angle of the channel.
5. Enter the Roughness value of the channel surface.
6. If using the Trapezoidal type, enter the Maximum Level for the channel.
The Level field is populated with the dataset for which you want to create a flow rate dataset; this will be the input data. This field is populated by selecting a dataset from the Sites panel on the left of the page. Like the Functions list, the panel can also be collapsed, using the Sites button, once a dataset has been selected.
The Select Site field is populated with all sites in the instance.
7. Click in the Select Site field to expand the field.
If the user has been assigned to a tenant, the list will only contain the sites in that tenant. Similarly, if Preferred Tags have been specified in the Preferences tab of the current user profile, the list will display a "Tags applied" indicator and only sites assigned those tags will be included in the list. If the "Show inactive sites..." option has not been enabled in the Preferences tab, only active sites will be available. See Preferences for more information on these options.
The list of sites can be filtered by specifying text in the Search field at the top of the list. Only sites that match the text specified will be included in the list. Advanced Search characters can also be specified with the text to perform different types of searches, some more specific, some more general. Clicking the Advanced Search Options link below the Search field will display a chart of the possible search types and how to use them. The AND/OR operators can also be used in combination with the other Advanced Search options if needed.
A drop-down list beside the Search field can be used to filter the list even further by specifying the property in which to search for the matching text. Also, when a property is selected from the drop-down list, clicking in the Search field will display a drop-down list of possible values based on the selected property, allowing a value to be selected instead of entering it manually. When an option is selected, only sites with text in the selected property (tenant, tag, etc.) will be available.
8. Select a site from the list.
All ingested datasets and computed datasets available for the selected site will be displayed in a drop-down list. Additional sites can be selected to display more datasets if needed.
9. [Optional] Select additional sites as needed.
10. Expand the datasets drop-down lists to view the available datasets.
The Properties button (...) beside each dataset in the list displays a dialog box containing information about the dataset.
11. Click a Level dataset in the list and, keeping the mouse button pressed, drag it into the Level field.
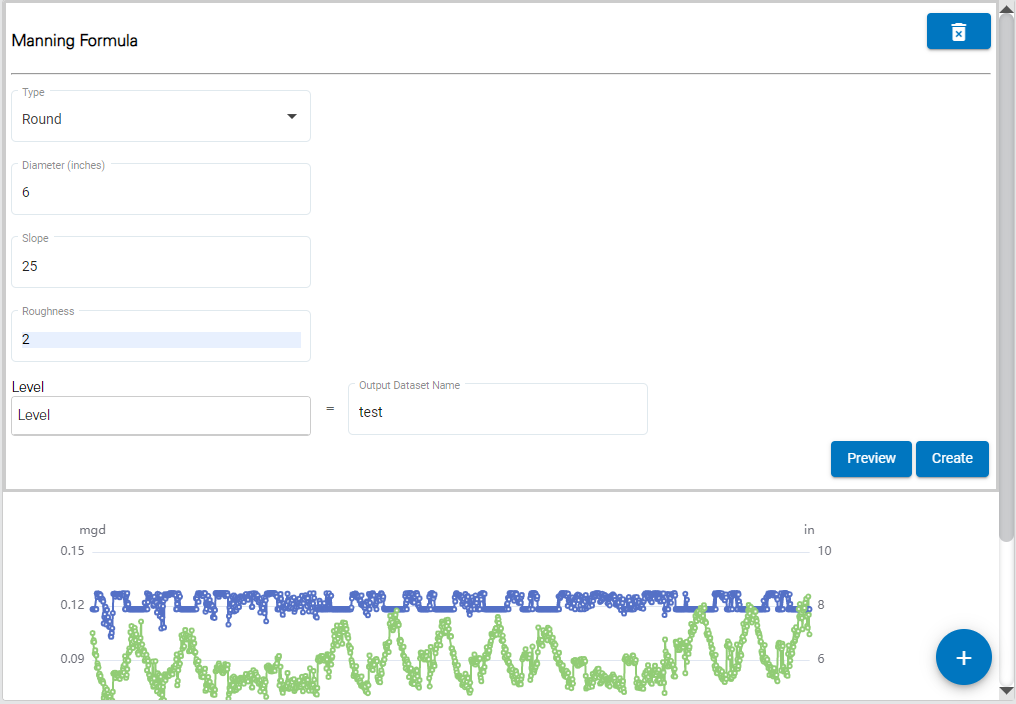
12. Type a name for the new dataset in the Output Dataset Name field.
Dataset names must be unique in the Cipher database. If an Output Dataset Name is entered that has already been used in any site in the Cipher instance, an error message will be displayed stating that the output name is already in use. Note that dataset names are not case sensitive, therefore "flowrate" is the same as "Flowrate" and "FlowRate". |
The Preview button can be used to view the resulting dataset in a sample graph below the expression fields. Like a regular graph, the mouse can be used to pan and zoom the data in the preview, and moving the cursor around the graph will display a tooltip populated with the data values at the cursor’s location.
The Date range fields are used to specify the range of data to include in the preview based on a time period. Specifying a date range reduces the amount of data being processed and reduces the processing time to generate the preview. The options include:
• Relative: This option will create a preview of the dataset where the end of the range is "now" and the start of the range is a set number of hours, days, weeks, or months previously from "now". A custom option is also available that can be used to specify the number of hours, days, weeks or months to include in the range.
• Static: This option will create a preview of the dataset using data from a specific start and end date.
13. Select the Date range settings for the preview of the dataset.
14. Click Preview.
15. Click Save to create the dataset.
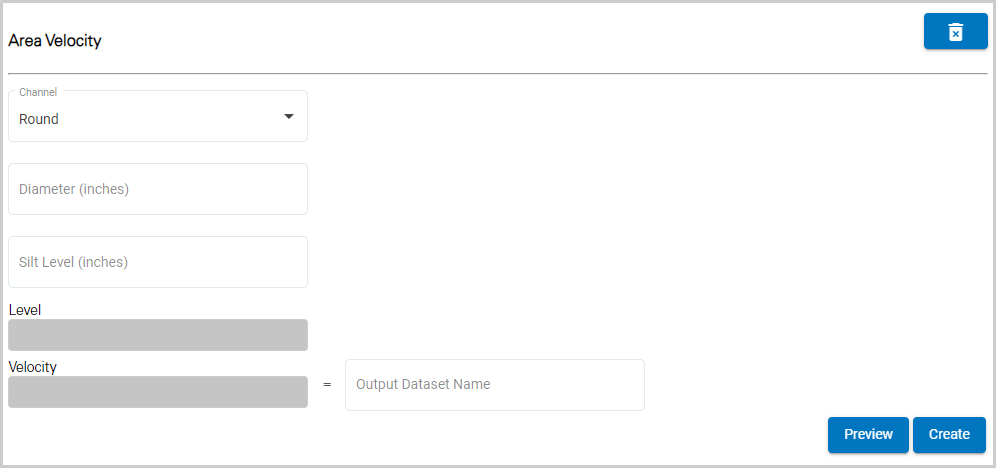
Area Velocity
The Area Velocity function is used to calculate a flow rate dataset using an area velocity formula. The calculation uses the channel type, size and silt level along with data from existing level and velocity datasets. The available channel types include:
• Round: For this type, the diameter of the channel must be specified along with the silt level.
• U Shaped: For this type, the width of the channel must be specified along with the silt level.
• Rectangular: or this type, the width of the channel must be specified along with the silt level.
• Trapezoidal: For this type, the width of the channel at both the top and the bottom must be specified along with the silt level and the maximum water level (in inches) for the channel.
• Elliptical: For this type, the width of the channel must be specified along with the silt level and the maximum water level (in inches) for the channel.
To compute a flow rate dataset using the Area Velocity function:
1. Using the left mouse button, click and drag the Area Velocity function into the middle of the page.
The Interval (min) field is used to specify the frequency with which points will be created in the computed dataset, measured in minutes. The default interval is 15 minutes.
2. Enter a value in the Interval (min) field.
3. Select a Channel type from the drop-down list.
4. Depending on the type selected, enter either a Diameter or Width(s) value for the channel.
5. Enter the Silt Level of the channel surface.
6. If using the Trapezoidal or Elliptical channel type, enter the Maximum Level for the channel.
The Level and Velocity fields are populated with the datasets for which you want to create a flow rate dataset; this will be the input data. These fields are populated by selecting datasets from the Sites panel on the left of the page. Like the Functions list, the panel can also be collapsed, using the Sites button, once datasets have been selected.
The Select Site field is populated with all sites in the instance.
7. Click in the Select Site field to expand the field.
If the user has been assigned to a tenant, the list will only contain the sites in that tenant. Similarly, if Preferred Tags have been specified in the Preferences tab of the current user profile, the list will display a "Tags applied" indicator and only sites assigned those tags will be included in the list. If the "Show inactive sites..." option has not been enabled in the Preferences tab, only active sites will be available. See Preferences for more information on these options.
The list of sites can be filtered by specifying text in the Search field at the top of the list. Only sites that match the text specified will be included in the list. Advanced Search characters can also be specified with the text to perform different types of searches, some more specific, some more general. Clicking the Advanced Search Options link below the Search field will display a chart of the possible search types and how to use them. The AND/OR operators can also be used in combination with the other Advanced Search options if needed.
A drop-down list beside the Search field can be used to filter the list even further by specifying the property in which to search for the matching text. Also, when a property is selected from the drop-down list, clicking in the Search field will display a drop-down list of possible values based on the selected property, allowing a value to be selected instead of entering it manually. When an option is selected, only sites with text in the selected property (tenant, tag, etc.) will be available.
8. Select a site from the list.
All ingested datasets and computed datasets available for the selected site will be displayed in a drop-down list. Additional sites can be selected to display more datasets if needed.
9. [Optional] Select additional sites as needed.
10. Expand the datasets drop-down lists to view the available datasets.
The Properties button (...) beside each dataset in the list displays a dialog box containing information about the dataset.
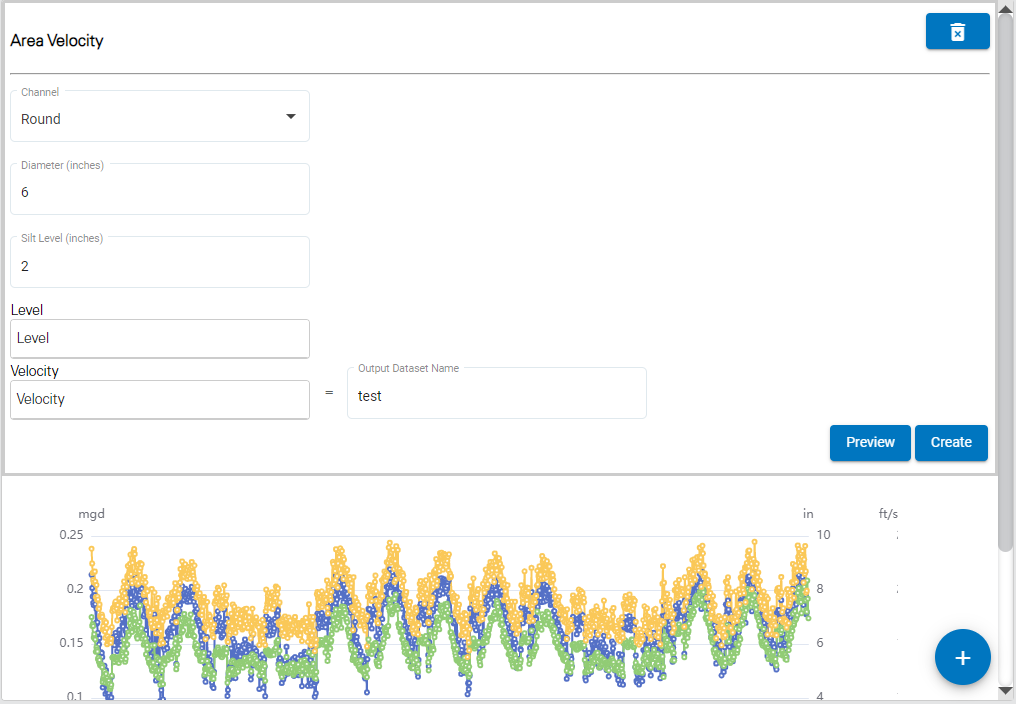
11. Click a Level dataset in the list and, keeping the mouse button pressed, drag it into the Level field.
12. Click a Velocity dataset in the list and, keeping the mouse button pressed, drag it into the Velocity field.
13. Type a name for the new dataset in the Output Dataset Name field.
Dataset names must be unique in the Cipher database. If an Output Dataset Name is entered that has already been used in any site in the Cipher instance, an error message will be displayed stating that the output name is already in use. Note that dataset names are not case sensitive, therefore "flowrate" is the same as "Flowrate" and "FlowRate". |
The Preview button can be used to view the resulting dataset in a sample graph below the expression fields. Like a regular graph, the mouse can be used to pan and zoom the data in the preview, and moving the cursor around the graph will display a tooltip populated with the data values at the cursor’s location.
The Date range fields are used to specify the range of data to include in the preview based on a time period. Specifying a date range reduces the amount of data being processed and reduces the processing time to generate the preview. The options include:
• Relative: This option will create a preview of the dataset where the end of the range is "now" and the start of the range is a set number of hours, days, weeks, or months previously from "now". A custom option is also available that can be used to specify the number of hours, days, weeks or months to include in the range.
• Static: This option will create a preview of the dataset using data from a specific start and end date.
14. Select the Date range settings for the preview of the dataset.
15. Click Preview.
16. Click Save to create the dataset.
Equation
The Equation function is used to calculate a flow rate dataset using a custom equation.
To compute a flow rate dataset using the Equation function:
1. Using the left mouse button, click and drag the Equation function into the middle of the page.
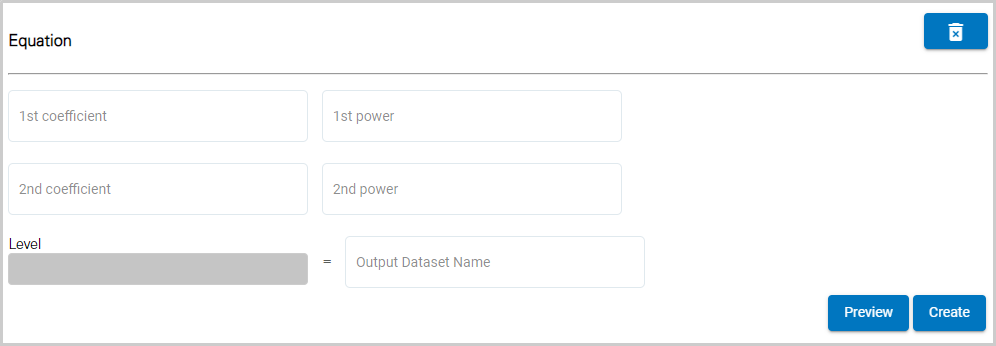
2. Enter values for the 1st and 2nd coefficient.
3. Enter values for the 1st and 2nd power.
The Level field is populated with the dataset for which you want to create a flow rate dataset; this will be the input data. This field is populated by selecting a dataset from the Sites panel on the left of the page. Like the Functions list, the panel can also be collapsed, using the Sites button, once a dataset has been selected.
The Select Site field is populated with all sites in the instance.
4. Click in the Select Site field to expand the field.
If the user has been assigned to a tenant, the list will only contain the sites in that tenant. Similarly, if Preferred Tags have been specified in the Preferences tab of the current user profile, the list will display a "Tags applied" indicator and only sites assigned those tags will be included in the list. If the "Show inactive sites..." option has not been enabled in the Preferences tab, only active sites will be available. See Preferences for more information on these options.
The list of sites can be filtered by specifying text in the Search field at the top of the list. Only sites that match the text specified will be included in the list. Advanced Search characters can also be specified with the text to perform different types of searches, some more specific, some more general. Clicking the Advanced Search Options link below the Search field will display a chart of the possible search types and how to use them. The AND/OR operators can also be used in combination with the other Advanced Search options if needed.
A drop-down list beside the Search field can be used to filter the list even further by specifying the property in which to search for the matching text. Also, when a property is selected from the drop-down list, clicking in the Search field will display a drop-down list of possible values based on the selected property, allowing a value to be selected instead of entering it manually. When an option is selected, only sites with text in the selected property (tenant, tag, etc.) will be available.
5. Select a site from the list.
All ingested datasets and computed datasets available for the selected site will be displayed in a drop-down list. Additional sites can be selected to display more datasets if needed.
6. [Optional] Select additional sites as needed.
7. Expand the datasets drop-down lists to view the available datasets.
The Properties button (...) beside each dataset in the list displays a dialog box containing information about the dataset.
8. Click a Level dataset in the list and, keeping the mouse button pressed, drag it into the Level field.
9. Type a name for the new dataset in the Output Dataset Name field.
Dataset names must be unique in the Cipher database. If an Output Dataset Name is entered that has already been used in any site in the Cipher instance, an error message will be displayed stating that the output name is already in use. Note that dataset names are not case sensitive, therefore "flowrate" is the same as "Flowrate" and "FlowRate". |
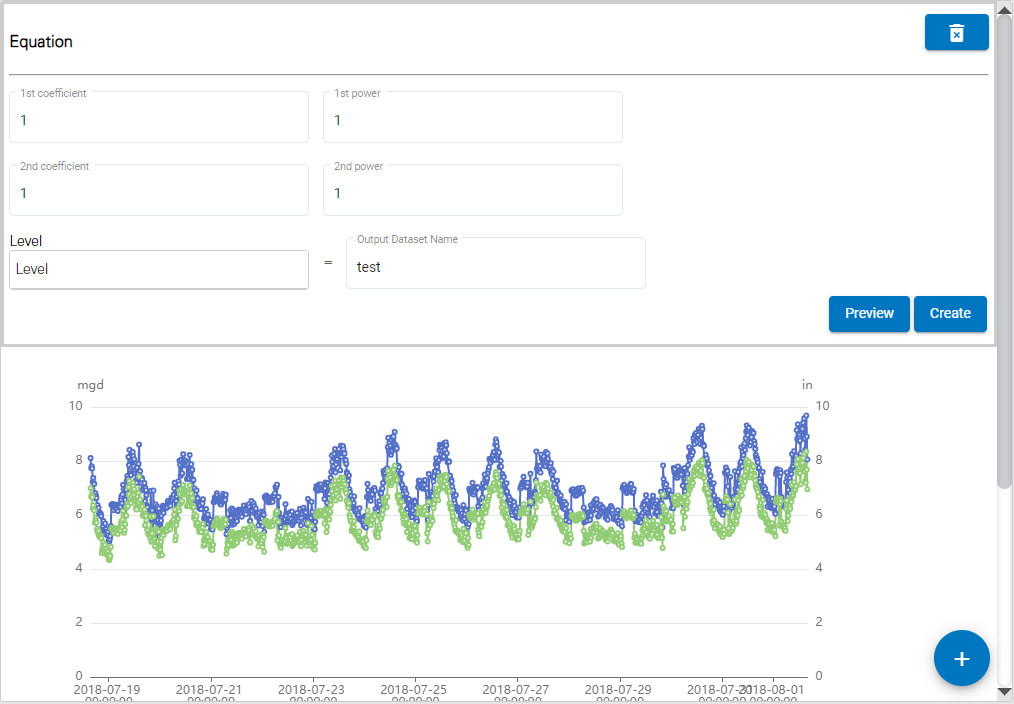
The Preview button can be used to view the resulting dataset in a sample graph below the expression fields. Like a regular graph, the mouse can be used to pan and zoom the data in the preview, and moving the cursor around the graph will display a tooltip populated with the data values at the cursor’s location.
The Date range fields are used to specify the range of data to include in the preview based on a time period. Specifying a date range reduces the amount of data being processed and reduces the processing time to generate the preview. The options include:
• Relative: This option will create a preview of the dataset where the end of the range is "now" and the start of the range is a set number of hours, days, weeks, or months previously from "now". A custom option is also available that can be used to specify the number of hours, days, weeks or months to include in the range.
• Static: This option will create a preview of the dataset using data from a specific start and end date.
10. Select the Date range settings for the preview of the dataset.
11. Click Preview.
12. Click Save to create the dataset.
Data Points: Level to Flow Rate
The Data Points: Level to Flow Rate function is used to calculate a flow rate dataset using a table of level values that correspond to flow rate values. A unit of measure can be selected for each the Level column and the Flow Rate column. These values are then used with an existing Level dataset to calculate a flow rate dataset.
The table can be populated manually by entering values in each cell of the table, or a comma separated text file with the data points can be uploaded to populate the table automatically. The format of the file requires that the first line contains the Units abbreviations, followed by lines with the data point pairs separated by commas.
To compute a flow rate dataset using the Data Points: Level to Flow Rate function:
1. Using the left mouse button, click and drag the Data Points: Level to Flow Rate function into the middle of the page.
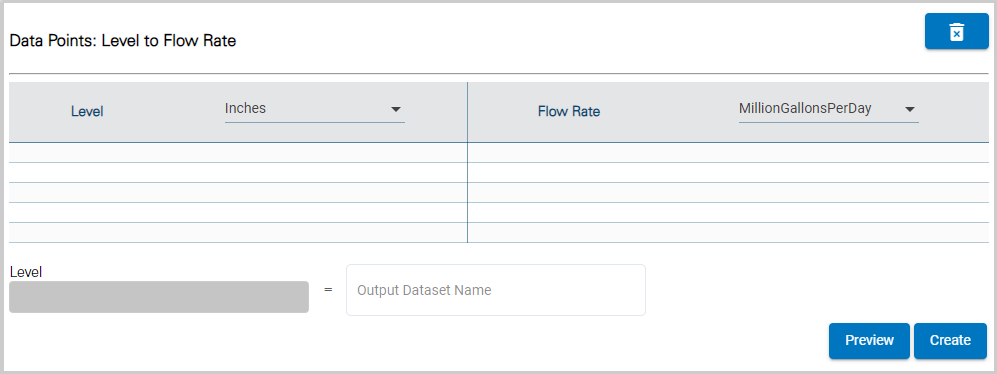
2. Select a unit of measure from the drop-down list for each column.
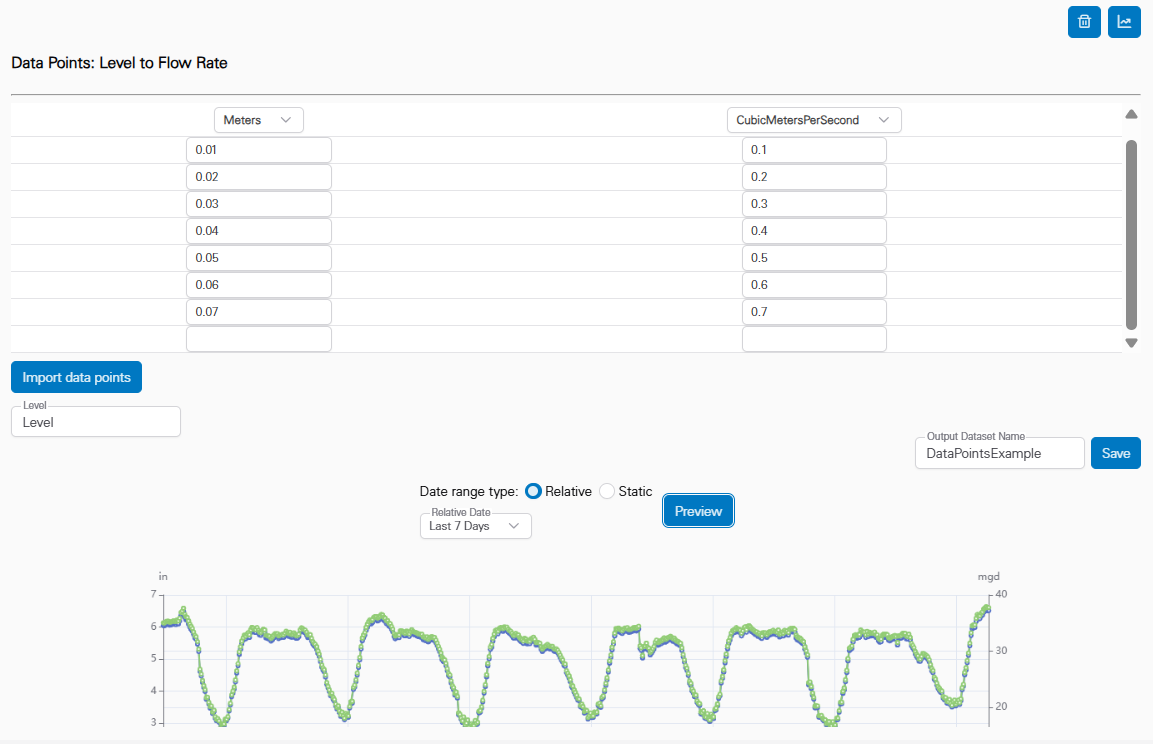
3. Populate the table by either:
• Entering the level values in Level column and the corresponding flow rate values in the Flow Rate column.
• Clicking the Import data points button to launch a Windows Open dialog box. Navigate to the relevant file and click Open. The table will be populated with the values from the file.
The Level field is populated with the dataset for which you want to create a flow rate dataset; this will be the input data. This field is populated by selecting a dataset from the Sites panel on the left of the page. Like the Functions list, the panel can also be collapsed, using the Sites button, once a dataset has been selected.
The Select Site field is populated with all sites in the instance.
4. Click in the Select Site field to expand the field.
If the user has been assigned to a tenant, the list will only contain the sites in that tenant. Similarly, if Preferred Tags have been specified in the Preferences tab of the current user profile, the list will display a "Tags applied" indicator and only sites assigned those tags will be included in the list. If the "Show inactive sites..." option has not been enabled in the Preferences tab, only active sites will be available. See Preferences for more information on these options.
The list of sites can be filtered by specifying text in the Search field at the top of the list. Only sites that match the text specified will be included in the list. Advanced Search characters can also be specified with the text to perform different types of searches, some more specific, some more general. Clicking the Advanced Search Options link below the Search field will display a chart of the possible search types and how to use them. The AND/OR operators can also be used in combination with the other Advanced Search options if needed.
A drop-down list beside the Search field can be used to filter the list even further by specifying the property in which to search for the matching text. Also, when a property is selected from the drop-down list, clicking in the Search field will display a drop-down list of possible values based on the selected property, allowing a value to be selected instead of entering it manually. When an option is selected, only sites with text in the selected property (tenant, tag, etc.) will be available.
5. Select a site from the list.
All ingested datasets and computed datasets available for the selected site will be displayed in a drop-down list. Additional sites can be selected to display more datasets if needed.
6. [Optional] Select additional sites as needed.
7. Expand the datasets drop-down lists to view the available datasets.
The Properties button (...) beside each dataset in the list displays a dialog box containing information about the dataset.
8. Click a Level dataset in the list and, keeping the mouse button pressed, drag it into the Level field.
9. Type a name for the new dataset in the Output Dataset Name field.
Dataset names must be unique in the Cipher database. If an Output Dataset Name is entered that has already been used in any site in the Cipher instance, an error message will be displayed stating that the output name is already in use. Note that dataset names are not case sensitive, therefore "flowrate" is the same as "Flowrate" and "FlowRate". |
The Preview button can be used to view the resulting dataset in a sample graph below the expression fields. Like a regular graph, the mouse can be used to pan and zoom the data in the preview, and moving the cursor around the graph will display a tooltip populated with the data values at the cursor’s location.
The Date range fields are used to specify the range of data to include in the preview based on a time period. Specifying a date range reduces the amount of data being processed and reduces the processing time to generate the preview. The options include:
• Relative: This option will create a preview of the dataset where the end of the range is "now" and the start of the range is a set number of hours, days, weeks, or months previously from "now". A custom option is also available that can be used to specify the number of hours, days, weeks or months to include in the range.
• Static: This option will create a preview of the dataset using data from a specific start and end date.
10. Select the Date range settings for the preview of the dataset.
11. Click Preview.
12. Click Save to create the dataset.
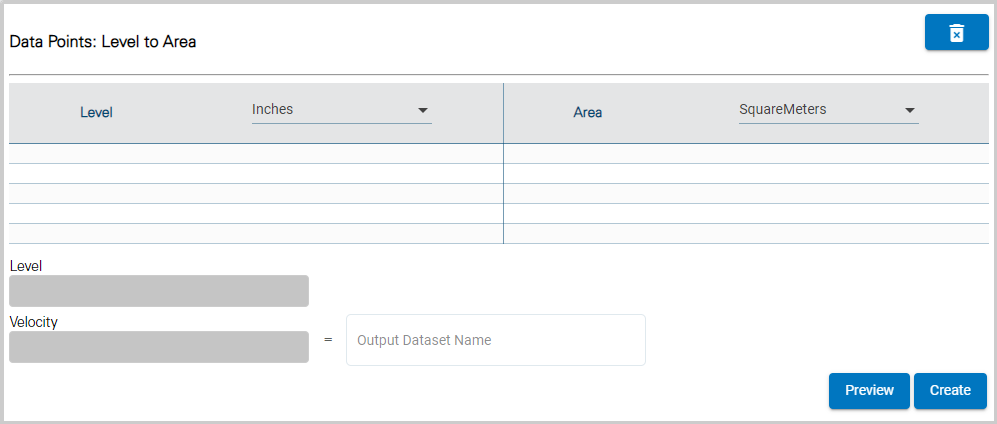
Data Points: Level to Area
The Data Points: Level to Area function is used to calculate a flow rate dataset using a table of user-specified level values that correspond to area values. A unit of measure can be selected for each the Level column and the Area column. These values are then used with existing Level and Velocity datasets to calculate a flow rate dataset.
The table can be populated manually by entering values in each cell of the table, or a comma separated text file with the data points can be uploaded to populate the table automatically. The format of the file requires that the first line contains the Units abbreviations, followed by lines with the data point pairs separated by commas.
To compute a flow rate dataset using the Data Points: Level to Area function:
1. Using the left mouse button, click and drag the Data Points: Level to Area function into the middle of the page.
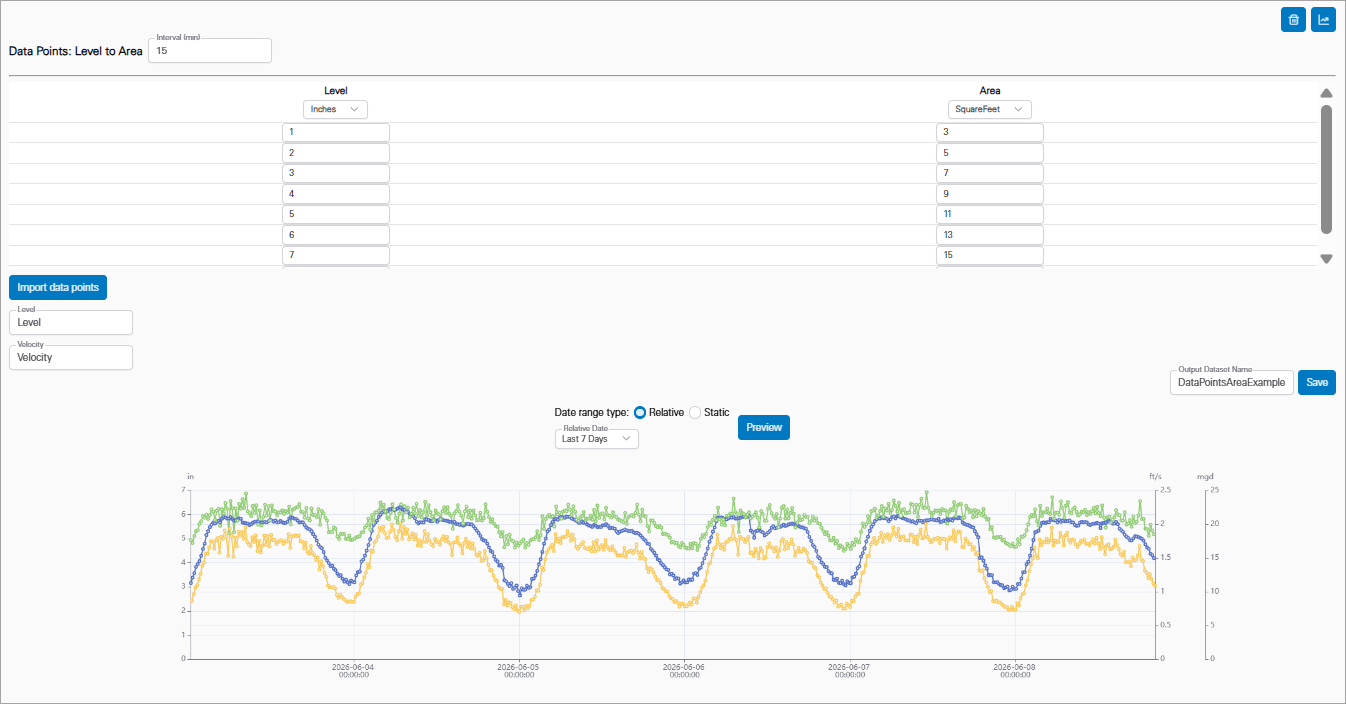
The Interval (min) field is used to specify the frequency with which points will be created in the computed dataset, measured in minutes. The default interval is 15 minutes.
2. Enter a value in the Interval (min) field.
3. Select a unit of measure from the drop-down list for each column.
4. Populate the table by either:
• Entering the level values in Level column and the corresponding area values in the Area column.
• Clicking the Import data points button to launch a Windows Open dialog box. Navigate to the relevant file and click Open. The table will be populated with the values from the file.
The Level and Velocity fields are populated with the datasets for which you want to create a flow rate dataset; this will be the input data. These fields are populated by selecting datasets from the Sites panel on the left of the page. Like the Functions list, the panel can also be collapsed, using the Sites button, once datasets have been selected.
The Select Site field is populated with all sites in the instance.
5. Click in the Select Site field to expand the field.
If the user has been assigned to a tenant, the list will only contain the sites in that tenant. Similarly, if Preferred Tags have been specified in the Preferences tab of the current user profile, the list will display a "Tags applied" indicator and only sites assigned those tags will be included in the list. If the "Show inactive sites..." option has not been enabled in the Preferences tab, only active sites will be available. See Preferences for more information on these options.
The list of sites can be filtered by specifying text in the Search field at the top of the list. Only sites that match the text specified will be included in the list. Advanced Search characters can also be specified with the text to perform different types of searches, some more specific, some more general. Clicking the Advanced Search Options link below the Search field will display a chart of the possible search types and how to use them. The AND/OR operators can also be used in combination with the other Advanced Search options if needed.
A drop-down list beside the Search field can be used to filter the list even further by specifying the property in which to search for the matching text. Also, when a property is selected from the drop-down list, clicking in the Search field will display a drop-down list of possible values based on the selected property, allowing a value to be selected instead of entering it manually. When an option is selected, only sites with text in the selected property (tenant, tag, etc.) will be available.
6. Select a site from the list.
All ingested datasets and computed datasets available for the selected site will be displayed in a drop-down list. Additional sites can be selected to display more datasets if needed.
7. [Optional] Select additional sites as needed.
8. Expand the datasets drop-down lists to view the available datasets.
The Properties button (...) beside each dataset in the list displays a dialog box containing information about the dataset.
9. Click a Level dataset in the list and, keeping the mouse button pressed, drag it into the Level field.
10. Click a Velocity dataset in the list and, keeping the mouse button pressed, drag it into the Velocity field.
11. Type a name for the new dataset in the Output Dataset Name field.
Dataset names must be unique in the Cipher database. If an Output Dataset Name is entered that has already been used in any site in the Cipher instance, an error message will be displayed stating that the output name is already in use. Note that dataset names are not case sensitive, therefore "flowrate" is the same as "Flowrate" and "FlowRate". |
The Preview button can be used to view the resulting dataset in a sample graph below the expression fields. Like a regular graph, the mouse can be used to pan and zoom the data in the preview, and moving the cursor around the graph will display a tooltip populated with the data values at the cursor’s location.
The Date range fields are used to specify the range of data to include in the preview based on a time period. Specifying a date range reduces the amount of data being processed and reduces the processing time to generate the preview. The options include:
• Relative: This option will create a preview of the dataset where the end of the range is "now" and the start of the range is a set number of hours, days, weeks, or months previously from "now". A custom option is also available that can be used to specify the number of hours, days, weeks or months to include in the range.
• Static: This option will create a preview of the dataset using data from a specific start and end date.
12. Select the Date range settings for the preview of the dataset.
13. Click Preview.
14. Click Save to create the dataset.
Once a dataset has been computed, the page remains open and the new dataset is added to the Sites list under a Computed Datasets category. The Create New Graph button  in the top-right corner of the function fields can be used to go to the Configure Graph page with the site preselected according to the site used to create the computed dataset. From here a graph can be created using the new computed dataset. See Configure Graph for information on this page.