The Create a Report tool is used to generate a statistical report for a site based on the datasets in the site. This tool is launched from the Reports List page.
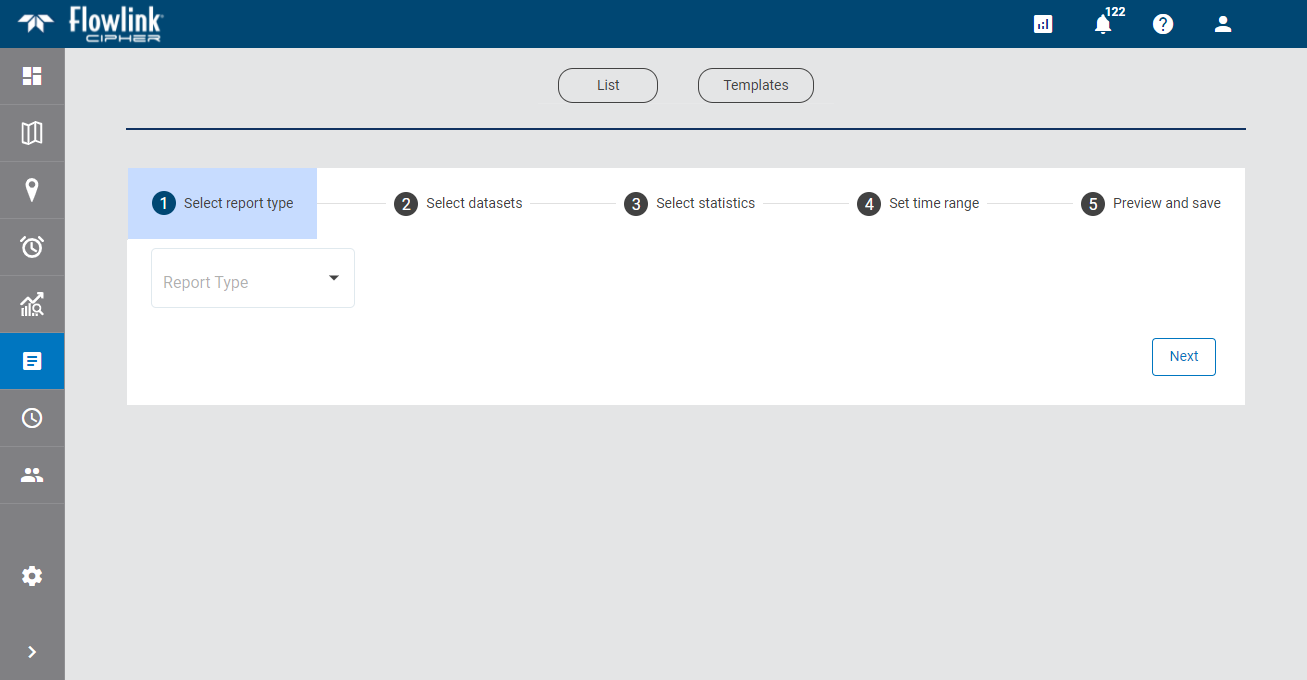
Step 1: Report Type
The first step of the process is to select the report type. This determines the type of report that will be created and the fields that will be displayed in the other steps of the process.
Currently, the possible report types include:
• Site Statistics: a statistical report for a site based on the datasets in the site. The options for this report type are explained in the links below.
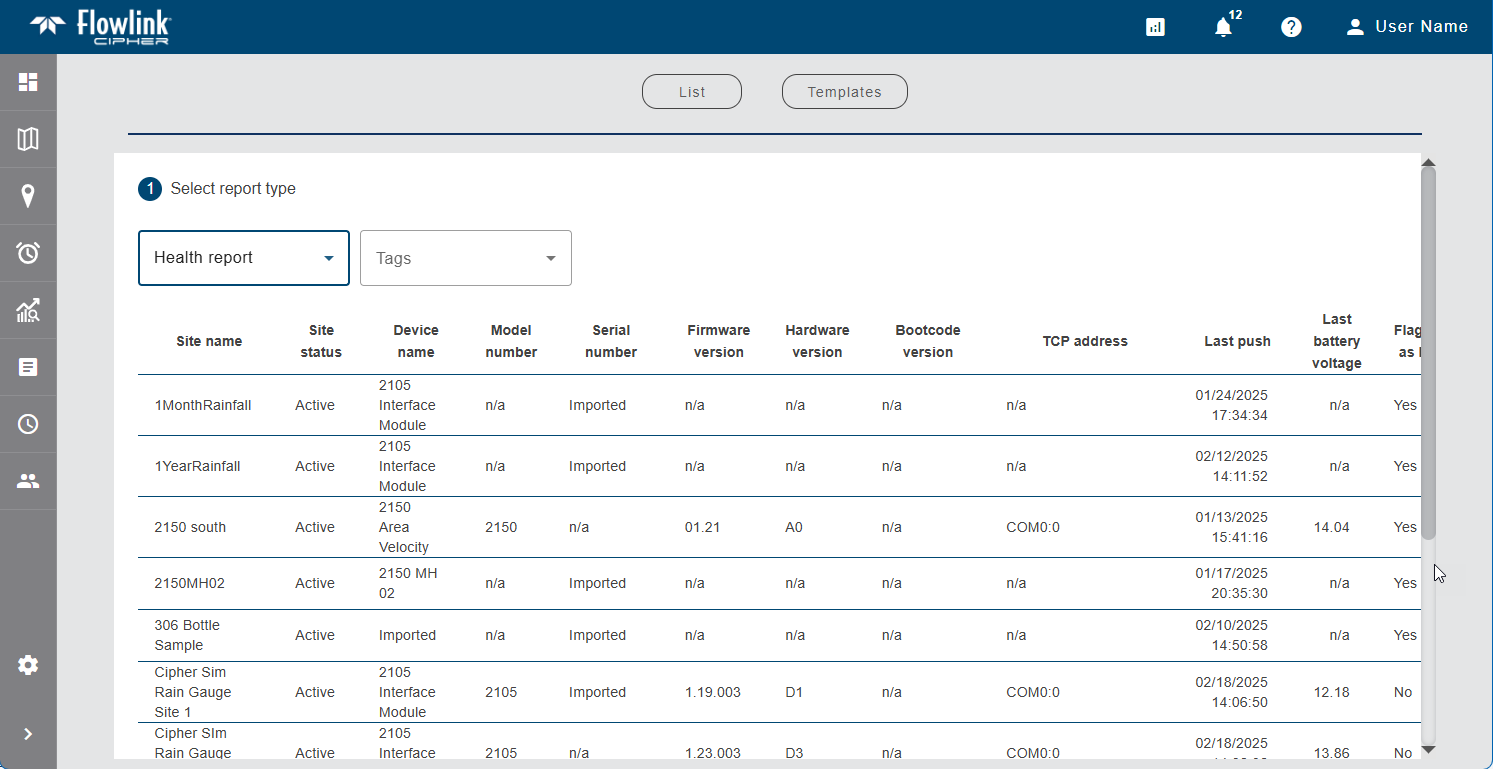
• Health Report: a table of health information for all sites in the Cipher instance. Health information includes things like the site name, its status, the timestamp of the last data push from the site, metadata about the site devices and battery voltage. The sites included in the report can be filtered by selecting tags in the Tags drop-down list. Only sites that have been assigned the selected tags will be included in the report. The resulting table can be downloaded as a CSV file. An example is shown below.
1. Select an option from the drop-down list.
2. If Site Statistics was selected, click Next.
If Health Report was selected, either:
• click Download CSV and select a location for the resulting file to save the report as a CSV file, or
• click Download PDF and select a location for the resulting file to save the report as a PDF file.
For a Health report, the file is saved to the specified location with a filename that identifies the type of report and the timestamp of when it was created. The file contains the site information, listed alphabetically by site name, as was shown in the preview of the report creation wizard. This completes the Health Report creation process.
For a Site Statistics report, clicking the Next button displays the next step in the creation process. Once a step has been completed, the number beside the step name changes to an Edit icon ![]() , indicating that the step has been completed. The settings for a completed step can be changed if needed. To return to a completed step, click the step name or click the Back button.
, indicating that the step has been completed. The settings for a completed step can be changed if needed. To return to a completed step, click the step name or click the Back button.
Step 2: Datasets
Step 2 of the process is used to select the site and datasets for which the report will be created. More than one dataset can be included in a report, but they must be from the same site. When multiple datasets are selected, each will be included in a separate column in the report.
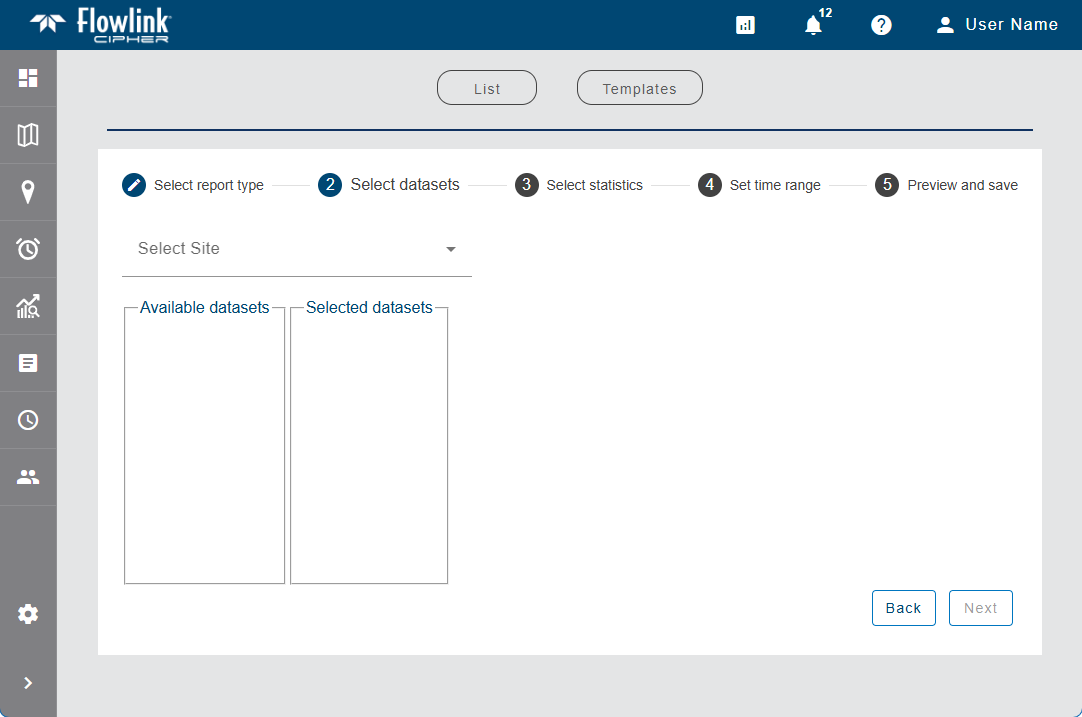
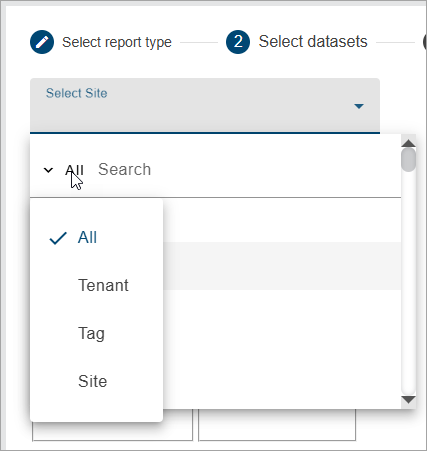
The Select Site field is used to select the site for the report. Clicking in the field displays a list of all sites available to the user. If the user has been assigned to a tenant, only sites in that tenant will be available. The list of sites can be filtered by entering text in the Search field at the top of the list. Only sites that match the text specified will be included in the list. A drop-down list beside the Search field can be used to filter the list even further by specifying the property in which to search for the matching text. When an option is selected, only sites with text in the selected property (tenant, tag, etc.) will be available.
1. Select a site from the Select Site drop-down list.
The Available datasets list will be populated with all dataset available for the selected site.
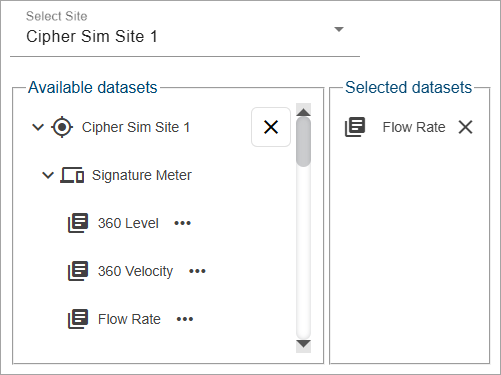
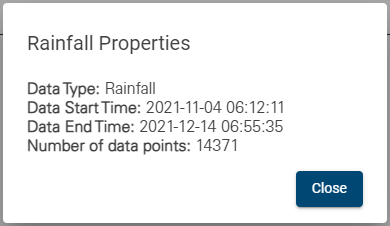
The Properties button (...) beside each dataset in the list displays a dialog box containing information about the dataset.
2. Click the desired dataset in the Available datasets list and drag it into the Selected datasets list.
3. Add any additional datasets as needed.
If multiple datasets are included, they can be ordered in the Selected datasets list to determine the order, left to right, that the datasets will appear in the columns of the report.
4. Click and drag the datasets in the Selected datasets list to place them in the correct order.
5. Click Next.
Step 3: Statistics
Step 3 of the process is used to define which statistics will be calculated in the report, and the settings that will be used to perform the calculations.
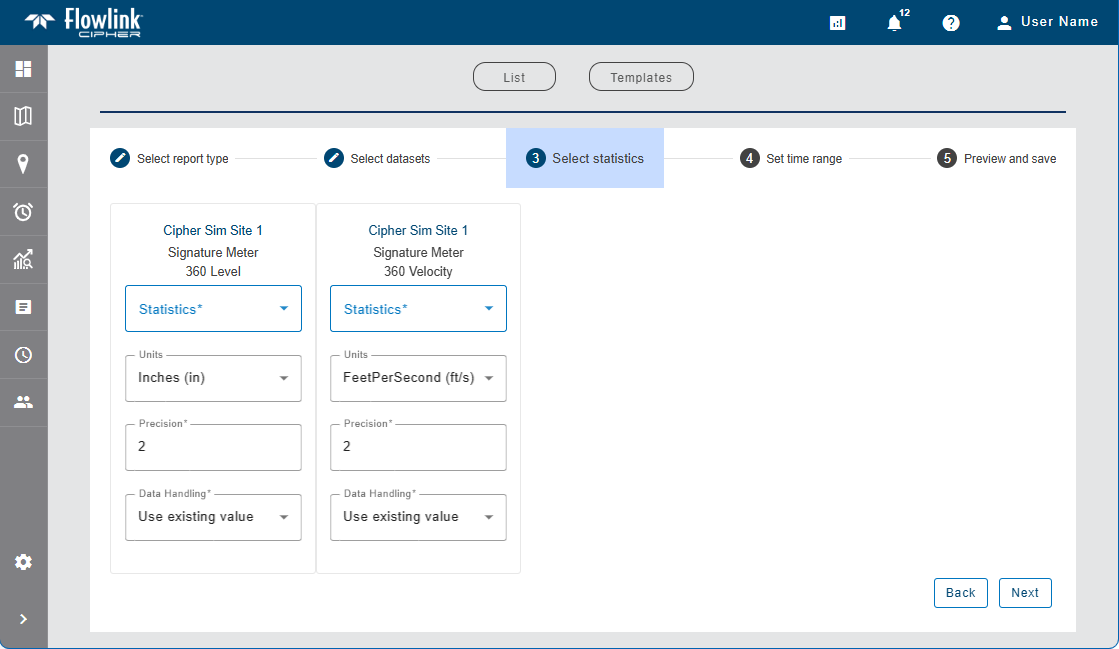
Settings are displayed for each dataset selected, identified by the dataset name, as well as the site and device from which the dataset was generated. If multiple datasets were selected, different settings can be selected for each dataset.
• Statistics: The statistics that will be calculated and included in the report.
• Units: The unit of measure to use for the values in the report. This will default to the settings in the Preferences tab of the User Profile screen, but can be changed to any unit supported by the data type of the selected dataset. For example, a Temperature dataset will only have Celsius and Fahrenheit as possible values.
• Precision: The number of decimal places that will be included in the values in the report. The default is 2 digits to the right of the decimal point.
• Data Handling: The method that will be used to handle points in the report that have error codes associated with them. This setting overrides the Data Handling option in the Preferences tab of the User Profile screen that is applied to all datasets by default. There are four possible settings:
• Use existing value (default): The point retains its current value.
• Use zero reading: A zero reading will replace the value of the point value.
• Repeat last reading: The point value is updated to use the value of the previous point in the dataset.
• Interpolate: A value is interpolated for the point using the last non-zero, non-error values, before and after the error point(s).
See Preferences for more information on the default values for these options.
1. Expand the Statistics list and click the check box of each statistic to be calculated in the report.
2. Select the Units, Precision and Data Handling settings for each dataset.
3. Click Next.
Step 4: Time Range
Step 4 of the process is used to define the time range and sampling interval to be included in the report.
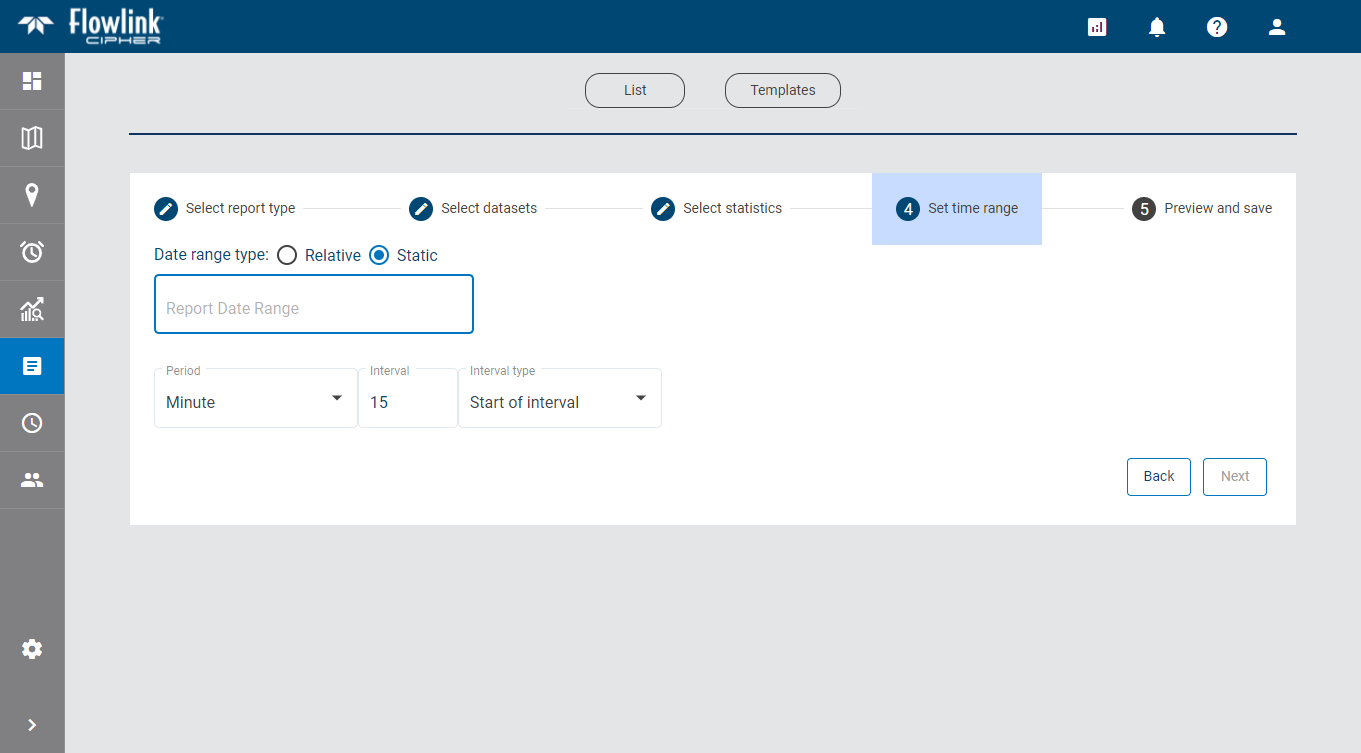
The time range can be defined as:
• a relative time period, such as This Week or This Month. This option also allows a custom number of days, month, years, etc. to be specified for the range.
• a static time period defined by start and end dates and times.
To define a static time range:
1. Select the Static option.
2. Click the Report Date Range field to display a calendar widget.
3. Click the desired start date and select a time to populate the From field in the widget.
4. Click the desired end date and select a time to populate the To field in the widget.
5. Click Set.
The widget is closed and the selected range is displayed in the field.
To define a relative time range:
1. Select the Relative option.
2. Select an option from the Report Date Range drop-down list.
3. If Custom is selected, enter a numeric value and select a measure of time from the drop-down list.
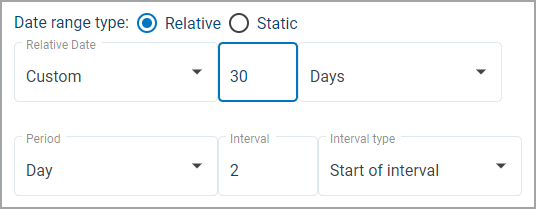
The sampling interval for the report is defined by selecting a time period and the frequency of that time period to include in the calculations for each entry in the report.
The Period field determines the length of time included in each sample. Data points from this time period will be included in the calculation. The Interval field determines the frequency of the selected period to be included in the sample. As an example, with a Period of Hours and an Interval of 2, calculations would be reported for all points in each 2 hour span within the specified time range.
The Interval type field determines whether sampling of data points starts at the beginning of an interval timestamp or the end. For example, a 1 hour interval would be reported as 13:00 - 13:59 for Start of interval, but 13:01-14:00 for End of interval, resulting in different points being analysed for the sample based on the type.
4. Select an option from the Period drop-down list.
5. Define the Interval value by typing a value in the field or selecting a value using the Up and Down Arrow buttons.
6. Select the Interval type.
7. Click Next.
Step 5: Preview and Save
Step 5 of the process is used to preview the report and summary table of the selected data and then save it to the database and/or export it to PDF or CSV format. The Save to database and Download buttons will not enable until a preview has been generated. The preview allows the report settings to be adjusted if needed before creating the final report.
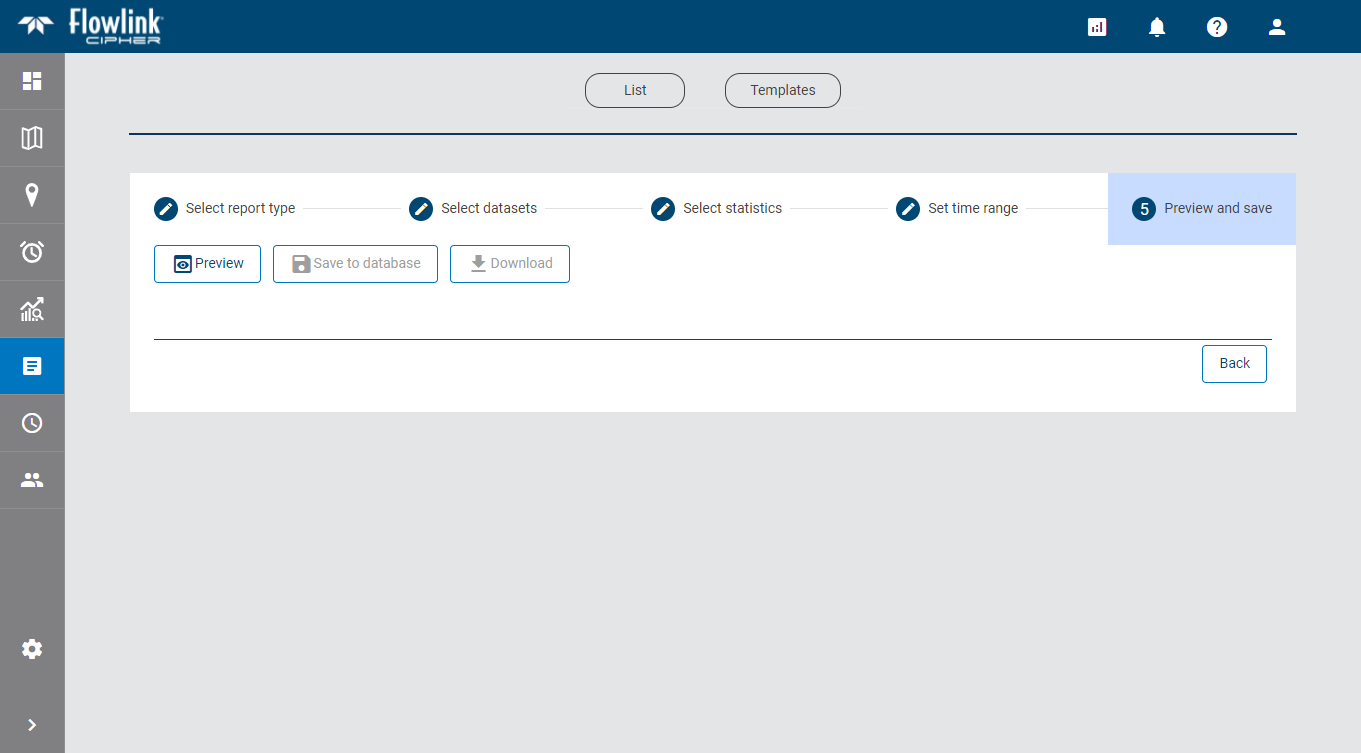
1. Click Preview to view the report.
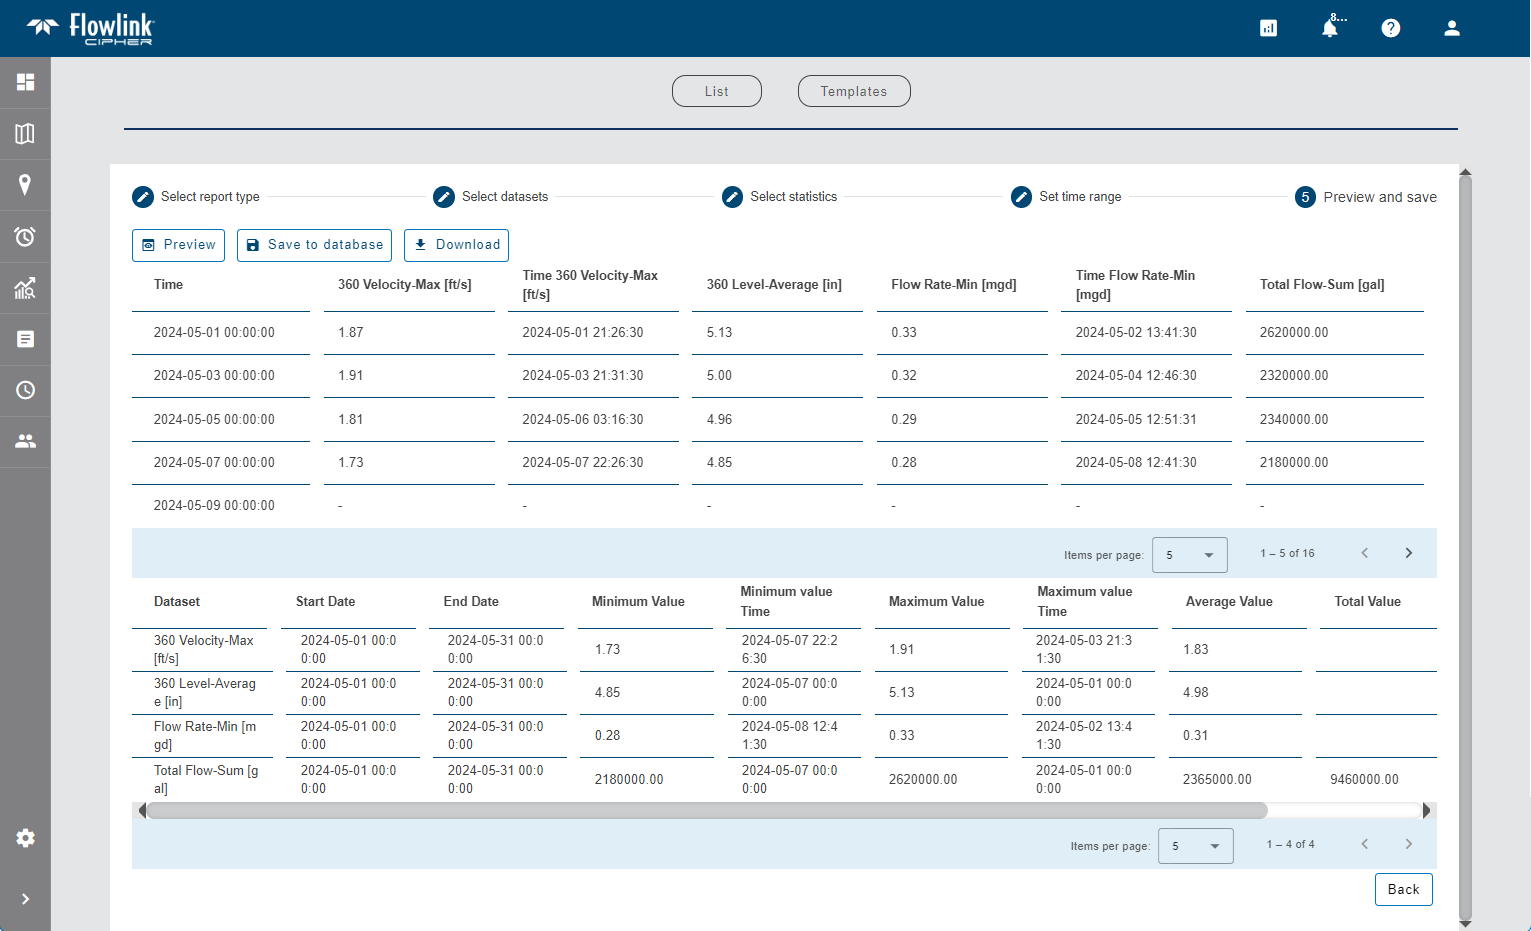
The report and summary table are displayed in the application. The first column of each row in the report is always the date and time of the beginning of the interval. After that, each column represents the statistics calculated for each dataset, with titles representing the dataset name and the statistic reported. If more than one statistic was calculated for a single dataset, a separate column is added for each statistic.
A summary table is shown below the report. This contains a summary of the statistics for each of the columns, including:
• the start and end dates for the data,
• the overall minimum value of the data in each dataset,
• the overall maximum value of the data in each dataset,
• the overall average value of the data in each dataset,
• the overall sum of the data (with appropriate calculation of sum for Flow Rate and Rainfall), and
• the number of points included in the statistics.
Note: Sum applied to Flow Rate is the total volume. Sum applied to Rainfall is the sum of the values during the interval.
To save the report to the database:
1. Click Save to database.
A dialog box is displayed with the following options:
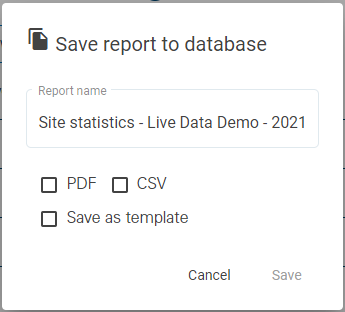
• Report name: The name to assign to the report. By default, this is populated with the report type, the site name and the creation timestamp.
• PDF: Save the report to the Cipher database in PDF format. This option makes the report available for other users to download and view at any time. The data itself is not saved with the report, only the report is stored.
• CSV: Save the report to the Cipher database in CSV format. This option makes the report available for other users to download and view at any time. The data itself is not saved with the report, only the report is stored.
• Save as template: Create a report template using the settings defined for this report. The template can then be used to create future reports. See Report Templates for more information on report templates. If this option is enabled, additional fields are added to the dialog box.
2. [Optional] Edit the Report name, if needed.
3. Click the check box for each output format to be saved.
4. [Optional] Click the Save as template check box.
Additional fields are added to the dialog box.
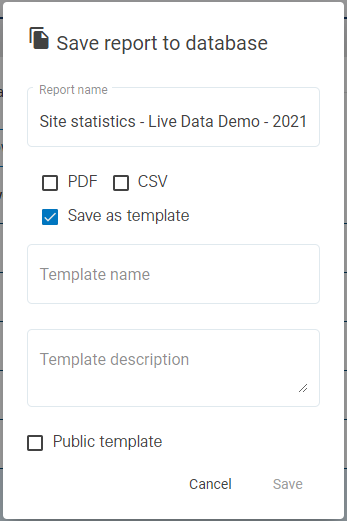
5. Enter a Template Name and Template Description.
6. Click the Public Template check box if the template needs to be available to other users.
7. Click Save.
A message will be displayed stating that the report was saved to the database in the selected format(s) and is now available in the list on the Reports List page.
If Save as template was selected, the template is now available from the Templates page.
To download the report to a file:
1. Click Download.
A dialog box is displayed with the following options:
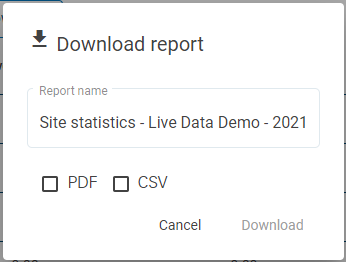
• Report name: The name to assign to the report. By default, this is populated with the report type, the site name and the creation timestamp. This will also be used in the file name of the resulting file.
• PDF: Download the report as a file in PDF format.
• CSV: Download the report as a file in CSV format.
2. [Optional] Edit the Report name, if needed.
3. Click the check box of each output format to be created.
4. Click Download.
A Save As dialog box is displayed.
5. Specify a name and location for each file format and click Save to export the files.