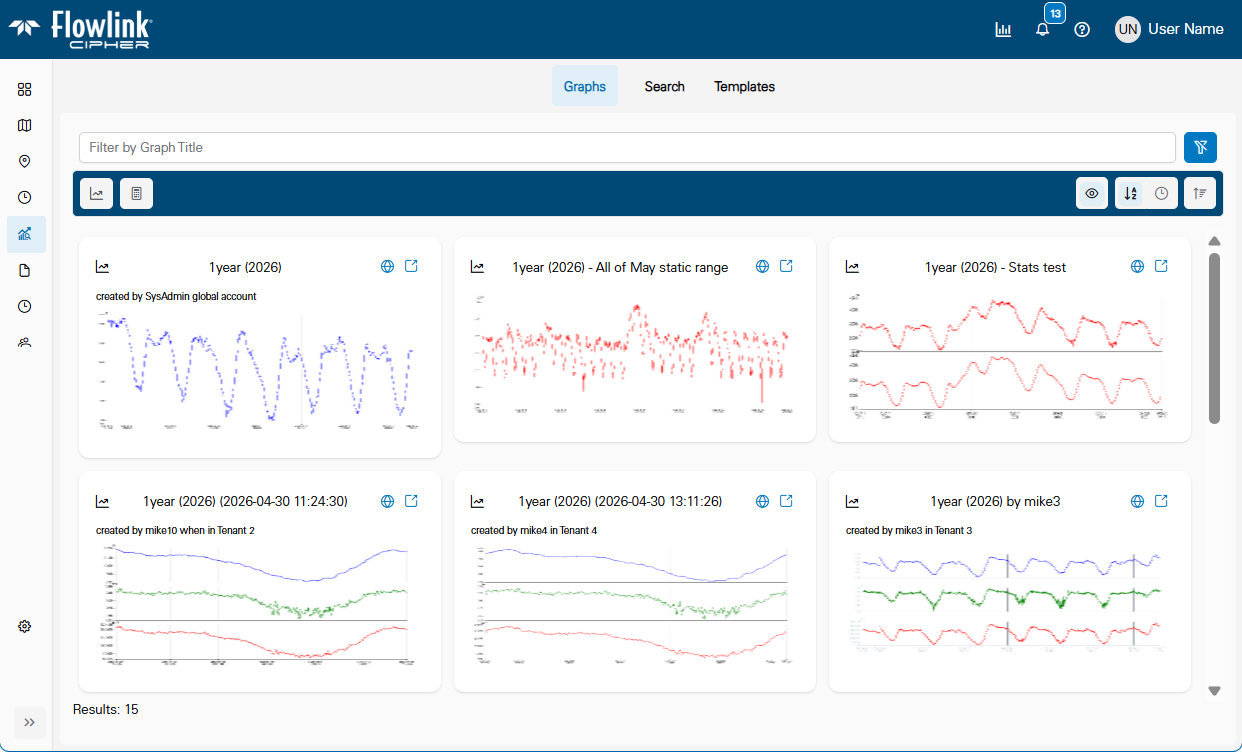
The Graphs screen displays a list of graph cards representing the graphs available in the Flowlink Cipher database.
The Filter by Graph Title field can be used to search for a specific graph using any of the characters that appear in the graph's name. As characters are entered in the field, the list of available graphs will be filtered. The text is matched to consecutive characters in the graph names. The filter is not case sensitive therefore upper or lower case characters can be entered. The filter terms are remembered when you leave the page and are automatically reapplied if you return. The relevant graph can then be selected from the list. The Clear all filters button  can be used to clear the filtering of the graph list.

The header bar above the list of graph cards contains tools that can be used to sort and filter the display of the graph cards.
• Sort graphs by  : Clicking this button will display a list of options for sorting the graph. The option selected here determines what value will be used when the graph is sorted in either ascending or descending order using the Sort button. The graphs can be sorted according to: graph title, graph subtitle, the user that created the graph or the creation date of the graph.
• Sort  : Click this button will change the direction that the graph cards are sorted in, either ascending or descending, according to the option selected for the Sort By function.
• Show/Hide Public Graphs  : Clicking this button will display or hide the graph cards for public graphs, which are graphs created by other users that are set as being public. Public graphs are hidden by default.
• Grid View / List View : Clicking this button toggles the format used to display the available graphs. Grid view will display cards representing each graph in a grid layout. List View will display a list of the graphs in a table format. When in list view, controls are provided below the table to control the number of graphs displayed per page and which page of the table is displayed.
Below the list is a Results field that reports the number of graphs currently displayed in the list. This number will update as the list is filtered or new graphs are added.
The graph cards provide a preview of the graph and buttons for launching actions on the graph. Below is an example of a graph card.
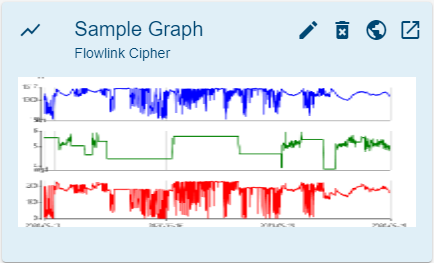
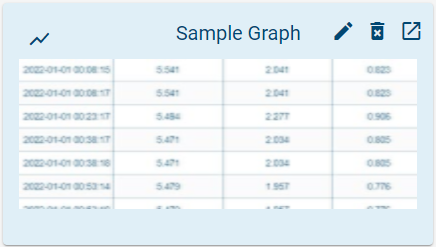
When the graph is open, it is possible to turn off the graph display and instead display the graph data in a table format. If the graph display is turned off, the graph card will show a generic image of a table instead of the graph preview. This image does not contain any actual data from the graph.
Tools are provided for interacting with the graphs. When in the grid view, the tools are provided when hovering the mouse cursor over a graph card. When in list view, the tools are provided in each row of the table. These tools are explained below.
Button | Description |
|---|---|
| Edit graph This button is only available to the owner of the graph. Click the button to open the graph in the Configure Graph screen. |
| Delete graph This button is only available to the owner of the graph. When clicked, a message will be displayed confirming the deletion. Click Yes to delete the graph. A Don’t ask again option can be enabled to stop receiving the confirmation message when deleting graphs. When in list view, this tool is provided in the toolbar above the graphs. To enable the tool, the check box for the relevant graph must be checked. More than one graph can be selected if needed. The Delete Graph button can then be clicked, prompting the same confirmation message as graph card tool. |
| Public graph This button indicates that the graph is a Public graph. There is no action associated with this button. |
| Open graph. Click this button to open the graph in the graph view screen. See Graph View for more information on this screen. |
The header bar of the list also provides tools to create new graphs  or compute new datasets
 .
1. Click Create a new graph to launch the Create New Graph page. See Configure Graph for more information on this page.
2. Click Compute a new dataset to launch the Compute Datasets page. See Compute Datasets for more information on this page.


