This area displays a map with an icon indicating the site location. The map is powered by OpenStreetMap. The plus and minus buttons in the map can be used to zoom the map in and out.
This page provides detailed information about a selected site. The page is divided into multiple sections and tabs, each of which are explained below.
In the top-left corner of the page is an arrow button that can be used to return to the Sites List screen.
Map
This area displays a map with an icon indicating the site location. The map is powered by OpenStreetMap. The plus and minus buttons in the map can be used to zoom the map in and out.
The location of the site can be updated on the map, if needed. Only users with the Editor role have the necessary permissions to change site locations. To change the site location:
1. Open the site information screen.
2. Pan and zoom the inset map to the relevant location.
3. Click the Edit button  in the General tab.
The coordinates can now be updated manually by typing new values in the Latitude and Longitude fields, or by moving the cursor over the inset map and clicking the new location for the site.
Note the change in the cursor when hovering over the inset map in Edit mode.
4. Select/Enter the new location for the site.
If the inset map was used to select the new location, the Latitude and Longitude fields in the General tab are automatically updated to display the coordinates of the selected location.
5. Click Save.
The location of the site will also be updated on the main Map page.
The color of the icon in the map indicates the status of the site.
• Green: The site is active and has no alarms.
• Grey: The site is inactive.
• Yellow: The site is active and has a silent-site alarm.
• Red: The site is active and has a data alarm.
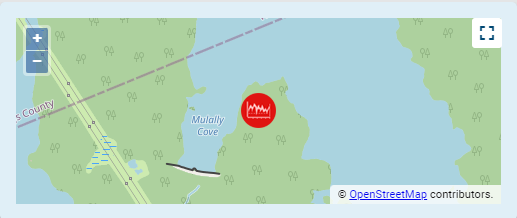
If the site does not have valid coordinates populated on the information page, a message will be displayed in the bottom-right corner of the screen and the site icon will not be displayed on the map. |
The Expand Map button  in the top-right corner of the map can be used to go to the Map page, which provides a full page map view. See Map for more information.
Attachments
This area provides any documentation or image files related to the sensor that have been uploaded to the system. To add an attachment:
1. Click the Add button in the bottom-right corner of the Attachments area.
2. Navigate to the relevant file and click Open.
The attachment is added.
To view an attachment, click the thumbnail of the file in the Attachments pane of the page.
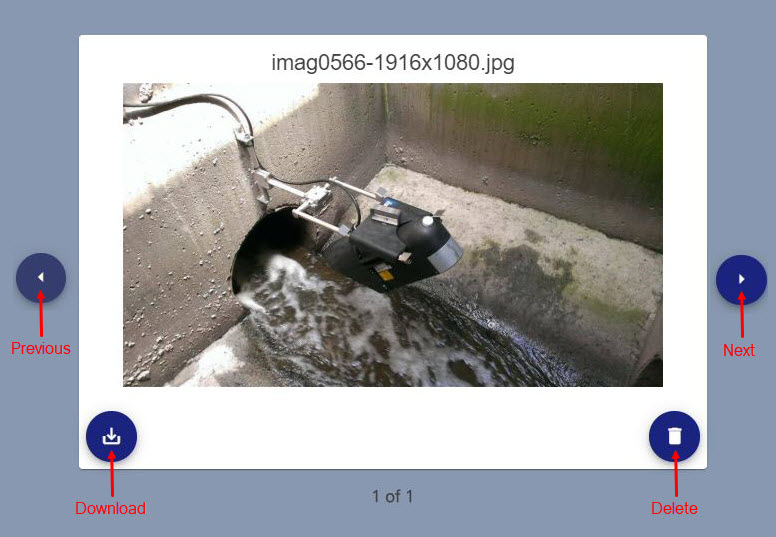
The attachment viewer displays the image or file in the attachment and the file name, as well as the number of attachments on the site. In this view, you can:
• Click the Previous and Next buttons to view other attachments.
• Click the Download button to save the file to your local computer.
• Click the Delete button to remove the displayed attachment from the site details page.
3. Click the X in the top-right corner to close the attachment and return to the site information page.
General Tab
This tab provides the general information about the site, such as its name, address, status, coordinates, assigned tenant, etc. It also displays the last received data values from datasets in the site with the name 'Voltage'.
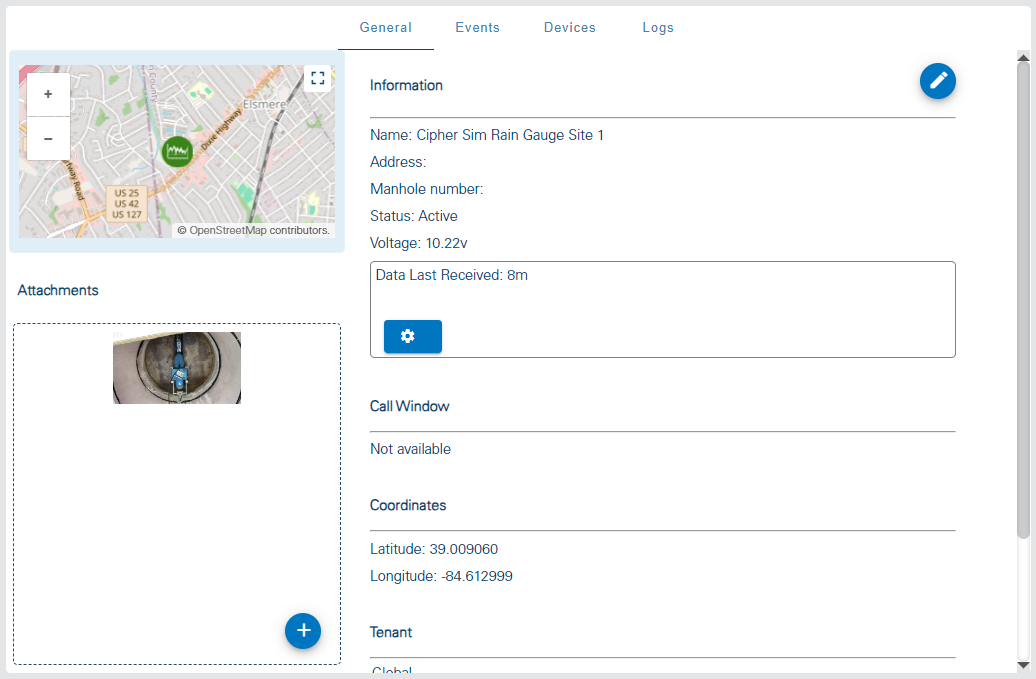
Information
Some information can be changed if needed using the following procedure:
1. Click the Edit button to enable edit mode for the tab.
2. Manually type or select new values for any of the fields.
3. Click the Save button  to apply any changes.
In the case of the site Name, additional steps are required because renaming a site causes a break in continuity of data. Changing the name of a site is only applied in Cipher; it is not applied to the meter for the site, meaning data pushes from the meter will continue to use the original site name. The meter name can be updated under the Devices tab. See Devices Tab for more information on that process. Because no site exists with the original site name, the first data push after the name change will cause a new site to be created with the original name. All new data going forward will be ingested into the new site with the original site name, while the previously ingested data will be held in the renamed site.
Note: The Site Manager role is required to rename a site. |
To change the site name:
1. Click the Edit button to enable edit mode for the tab.
2. Click the Modify Site Name button  that is displayed beside the Name field when edit mode is enabled.
A message will be displayed warning that the new name will not be applied to the site meter.
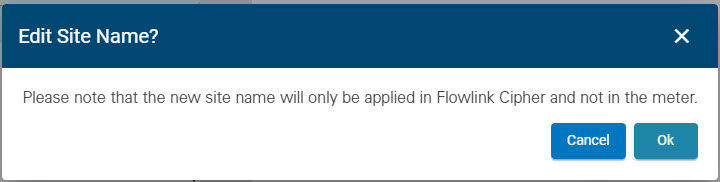
3. Click OK to continue with the name change.
The Name field is now editable.
4. Click in the Name field and type a new name.
5. Click the Save button to apply the change.
This tab also displays the elapsed time since the last data ingestion from the site. Controls are provided in the user Profile screen to enable or disable notifications when the site has stopped pushing data to the Flowlink Cipher database. See Profile for information on notifications. When enabled, a threshold can be defined in hours or days to trigger the notifications. By default, all new sites will have these notifications enabled with a threshold of one day. When the elapsed time surpasses the data received threshold, the site card on the Sites List will display a warning symbol and a tooltip stating that the site is no longer receiving data. To change the threshold for the notifications:
1. Click the Adjust threshold  button.
2. Ensure the Enabled check box is checked.
3. Select the duration value from the drop-down list.
4. Select days or hours for the duration period.
5. Click the Update button.
Call Window
The Call Window area displays information about the next available call window configuration found for a site. This information identifies the time and interval that a device is available for a connection. The call window information can come from either the configuration settings on a 2100 series device, or the most recent Program event triggered on a Signature meter. The device configuration settings can have multiple conditions that will trigger the device to send data to a site in Cipher. For example, one condition may be specified to send data during specific work day hours on a regular schedule, while a second condition may send data when an event is triggered based on values in the data. The configuration settings can be viewed in the Devices tab on this page. For sites that call window configuration cannot be found, this area will be populated as "Not available".
Tenant
The Tenant area identifies the tenant to which the site is assigned. When in edit mode, a Change Tenant button  is provided that can be used to change the assigned tenant.
1. Click the Edit button to enable edit mode for the tab.
2. Click the Change Tenant button.
3. Select a tenant from the list displayed.
4. Click the Save button to apply the change.
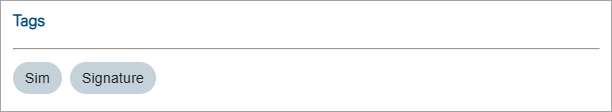
Tags
The Tags area is used to assign tags to the site. Tags can be used to help identify and organize sites. Once a tag has been assigned to a site, that tag can be used as search criteria when filtering sites in various place in the application. All tags assigned to a site are also displayed on the site’s card in the Site List screen.
To add or edit tags on a site:
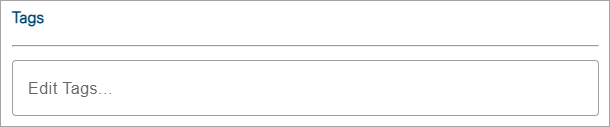
1. Click the Edit button to enable edit mode for the tab.
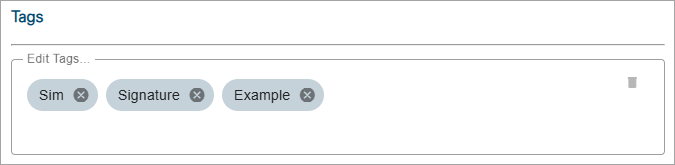
The Tags field changes to allow tags to be entered. If tags have already been assigned to the site, an X button will be added to each tag which can be used to remove a tag if needed.
New tags are created by typing the relevant text in the Edit Tags field and then pressing the <Enter> key. Once a tag has been created, it is available from a drop-down list to be added to other sites as needed. A newly created tag is automatically added to the site in which the tag was created.
2. Click in the Edit Tags field.
3. Add a tag to the site either by:
• typing a new tag in the field and pressing <Enter>, or
• selecting an existing tag from the drop-down list.
4. Click Save to save the changes to the site.
Events Tab
This tab provides a log of any activities relating to the site, such as the ingestion of data, assigning the site to a tenant, or a triggered alarm.
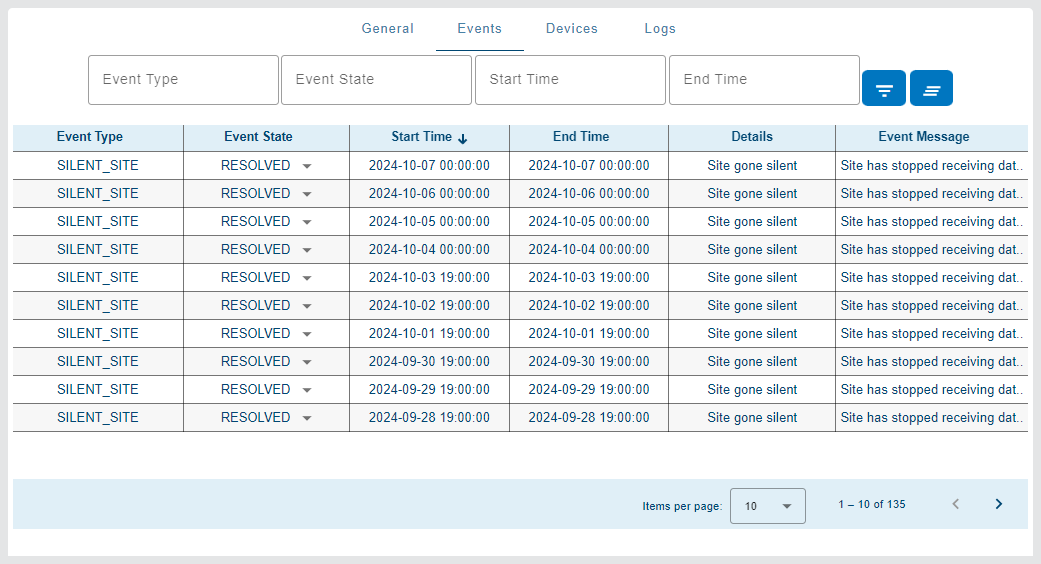
Each entry includes the event type, the state of the event, the start and end time of the event, details and a message explaining what happened. The possible states of the event include Active, Acknowledged and Resolved.
The list can be filtered using the Event Type, Event State, Start Time and End Time fields above the table. The possible event types include:
• Data
• Silent Site
• Program
• Summary
• Diagnostic
• History
• Sample
• Alarm
To apply a filter:
1. Select an Event Type or Event State from the relevant drop-down list or select a Start Time and/or End Time from the calendar tools.
The table will be filtered to display only events that match the filter criteria.
2. Click the X button in each filter field to remove the filter and return to the full table.
The table displays a maximum of 10 events by default. This limit can be changed using the Items per page control below the table. Navigation options also appear below the table when the number of events exceeds the set limit and more pages are needed. This control reports the total number of events in the complete table and the number of events in the current page of the table.
1. Select an option from the Items per page drop-down list.
2. Click the Next Page or Previous Page arrow to view a different page of events.
3. Click the First Page or Last Page double arrow to view the first or last page of the events.
The View Details button  in the table displays a dialog box containing information about the event.
The type of event determines the information provided in the event message. For example, a Silent Site event simply states that the site has stopped receiving data, whereas a Program event is populated with the program information from a 2100 series Signature meter and a Diagnostic event is populated with data values and a data table ingested from a device at the time the event was created, as is shown below.

For Data events, a graph of the event is provided along with general information about the event. A status control is also provided in the title bar of the dialog box. This control can be used to select the status of the event and save it to the system. The possible states are Active, Acknowledged and Resolved.

Devices Tab
This tab lists all devices installed at the site.
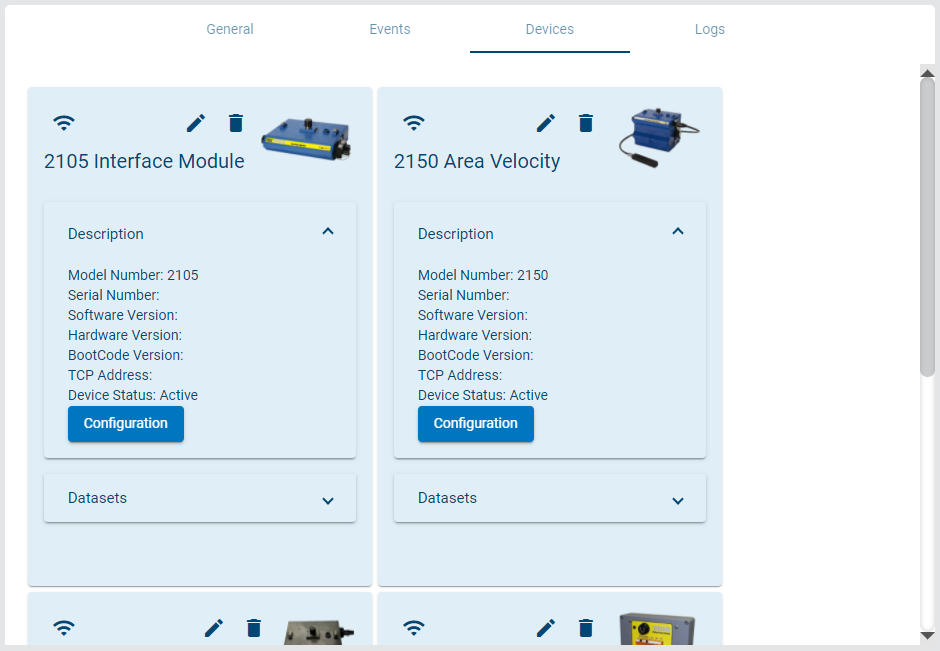
Each device installed at a site is displayed in the table along with information about the device.
The order of the devices in the table determines the following functions:
• The order in which the devices will be displayed in a dataset selection drop-down list, with the first device in the drop-down list being the left-most device on the Devices tab.
• The data that will be used by the Level, Velocity and Flow Rate from Site function on site cards of the Sites List screen.
• The graph that will be displayed in Site gadgets on the Dashboard.
The order of the devices can be changed if desired to ensure the preferred device data is used for the functions listed above. To change the order of device cards:
1. Click on the hamburger icon  of the device to be moved.
2. Keeping the mouse button pressed, drag the device to the desired position.
3. Release the mouse button.
Each table entry provides buttons to edit or delete  the device. When editing a device, the new device information is only applied in Cipher; it is not applied to the meter, meaning data pushes from the meter will continue to use the original information. The first data push after a name change will cause a new device to be created in the site with the original device name. All new data going forward will be ingested from the device with the original device name, while the previously ingested data will be held in Cipher with the new device name.
The System Administrator, Administrator or Site Manager role is needed to delete a device. When a device is deleted, any objects in Cipher derived from data ingested from the device, such as graphs, computed datasets and alarm settings, will show a warning that the source data is no longer available.
Editng or deleting a device from a site will create an entry in the site log.
To edit a device:
1. Click the Edit button.
A message will be displayed confirming that you want to change the device information.
2. Click OK to continue editing the device.
The row for the selected device is set to edit mode, making all fields editable.
3. Change the relevant device information.
4. Click the Save button.
Each device in the table also has a drop-down list of any datasets that have been created using data ingested from the device. This is displayed by clicking the arrow button in the device row.
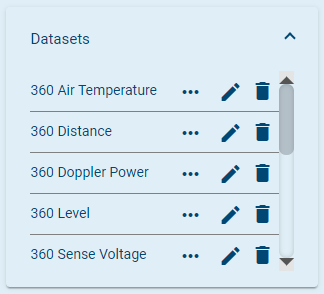
The Dataset list provides controls for renaming or deleting a dataset and viewing the properties of each dataset. Any time that a dataset is renamed or deleted, an entry will be added in the site log.
The datasets can also be sorted in this list. The sort order controls which Level, Velocity and Flow Rate type datasets are automatically selected when the site is selected for a site gadget on the dashboard, or when a new graph is created using the Level, Velocity and Flow Rate quick-graph function on a site card.
5. To change the dataset order, click and drag a dataset from one position to another in the list.
The System Administrator, Administrator or Site Manager role is needed to rename, delete or reorder datasets.
• Properties: Display a dialog box containing information about the dataset.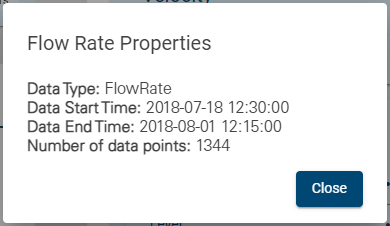
• Edit Dataset : Change the name of the dataset. The device name is only changed in Cipher, it is not applied in the device, which will cause a break in data continuity. The data in the original dataset will be held in Cipher with the new dataset name. The first data push after the renaming will create a new dataset using the original dataset name. To rename the dataset:
1. Click Edit Dataset for the relevant dataset.
A confirmation message will be displayed.
2. Click OK to continue with the renaming.
The name field will be put into edit mode.
3. Type a new name for the dataset.
4. Click the Save button.
• Delete Dataset : Delete the selected dataset. Deleting a dataset does not remove the data from Cipher, but the dataset is no longer available in dataset selection controls. Accessing objects that use the dataset, such as graphs, computed datasets and alarm settings, after it has been deleted will display a warning message that the source data is no longer available.
Once a dataset has been deleted, it cannot be recovered.
Logs Tab
This tab provides a log of all site-specific events, such as the addition of a device, data being imported or ingested, a change in the state of the site, changes in attachments, changes in settings, etc.
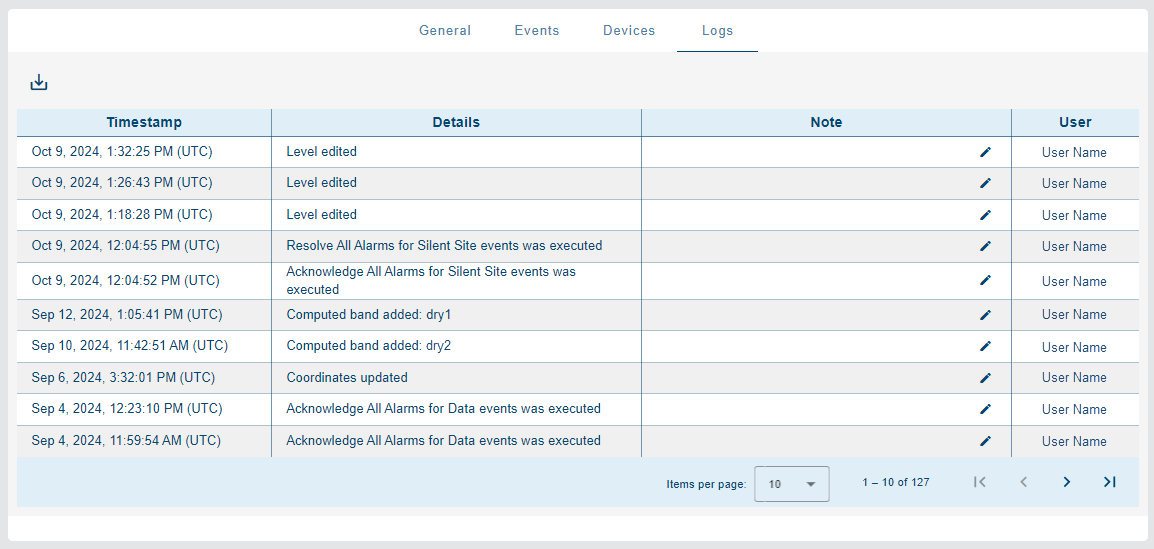
Each log entry includes the timestamp at which the entry was created, details of what caused the creation of the log entry and the user that performed the action that created the log entry.
A textual note can be added to an entry, if desired, to provide further information about the event. To add a note:
1. Click the Edit note button in the Note column of the relevant log entry.
2. Enter the text in the dialog box provided.
3. Click Save.
A maximum of 10 items is displayed in the table by default. This limit can be changed using the Items per page control below the table. Navigation options also appear below the table when the number of items exceeds the set limit and more pages are needed. This control also reports the total number of log entries and the number of entries current displayed. To change the display of items:
1. Select an option from the Items per page drop-down list.
2. Click the Previous page or Next page arrow to view a different page of entries.
3. Click the First page or Last page double arrow to view the first or last page of entries.
The Download Log File button  above the table can be used to download the log entries to a text file in the browser's default download location. If a default location has not been specified, a Save As dialog box is displayed to select a location.
1. Click the Download Log File button.
2. Define a name and location for the file.
3. Click Save.
The Add Log Entry button  , also above the table, can be used to manually create a log entry for the site.
1. Click the Add Log Entry button.
2. Enter the relevant information in the dialog box displayed, up to a maximum of 255 characters.
3. Click Save.
Related topics:
• Sites