The Sites List screen provides a list of all sites in the system available to the user. If the user is assigned to a tenant, the list will be limited to only the sites in that tenant. Similarly, if Preferred Tags have been specified in the Preferences tab of the current user profile, the list will display a "Tags applied" indicator and only sites assigned those tags will be included in the list. If the "Show inactive sites..." option has not been enabled in the Preferences tab, only active sites will be available. See Preferences for more information on these options.
The list can be displayed as either a grid of site cards or a table that lists the sites. The display can be changed using the Grid View/List View buttons which function as a toggle. Each view provides access to information for the sensors at a site location.
A number of other tools are also provided to control the display of the sites in both the grid and the list format.
Tool
Description
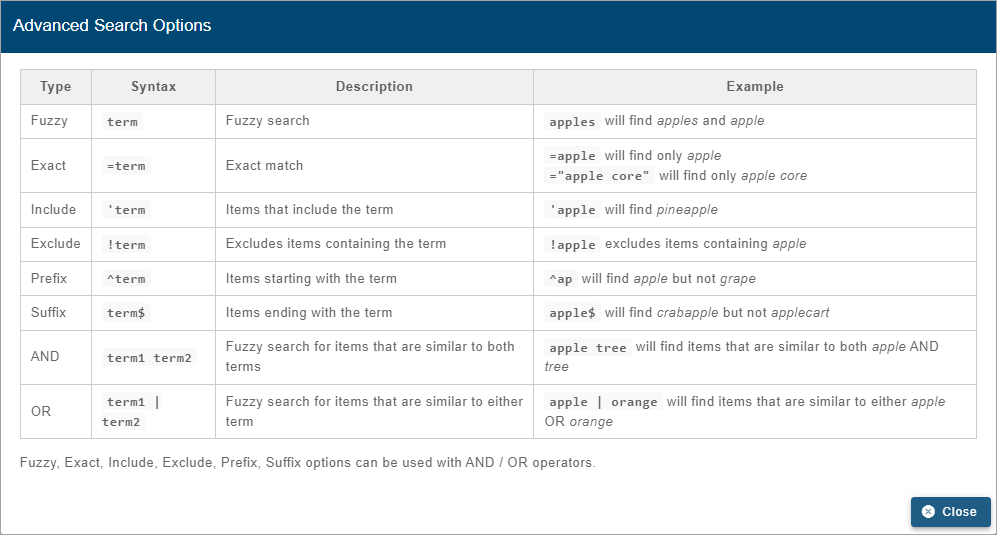
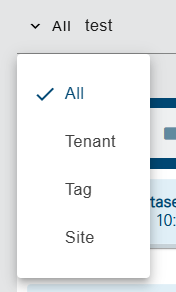
The Search field can be used to perform a text-based search for sites. As text is entered in the field, the list of sites is automatically filtered to display only the sites with a name, tenant and/or tag that match the text entered. Advanced Search characters can also be specified with the text to perform different types of searches, some more specific, some more general. Clicking the Advanced Search Options link below the Search field will display a chart of the possible search types and how to use them. The AND/OR operators can also be used in combination with the other Advanced Search options if needed.
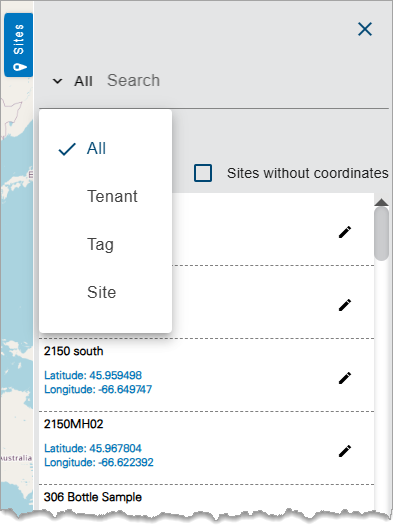
A drop-down list beside the Search field can be used to filter the list even further by specifying the property in which to search for the matching text. When an option is selected, only sites with text in the selected property (tag, site, etc.) will be available. Also, when a property is selected from the drop-down list, clicking in the Search field will display a drop-down list of possible values based on the selected property, allowing a value to be selected instead of entering it manually. The filter is not case sensitive, therefore upper or lower case characters can be entered.
The number of sites in the list will be displayed in a Results field below the list. This number will update if the search criteria changes and the list is changed. The Clear Filter button can be used to remove the filter from the site list.
The Reload site list button reloads the list of sites and quantities available in the tenant. This ensure the most recent information and data is displayed if changes were made since the page was last loaded.
The Upload button launches the Data Import Utility which can be used to import CSV and DDP format site data. New site cards will be added for the sites imported from the files. For more information, see Importing Data.
The Disable/Enable user preferred tags button is used to temporarily disable or enable the filtering of sites that is applied automatically if preferred tags have been defined in the Preferences tab of the user’s profile. See Preferences for information on this setting. When enabled, only sites with the preferred tags will be displayed in the list, regardless of other filter criteria that may have been specified. When disabled, the preferred tags setting is ignored and sites without those tags will be included in the list.
Note: This button is only available if tags have been defined in User Preferences. If the setting has not been defined, this button will not be displayed.
The Inactive Sites button can be used to enable or disable the display of inactive sites in the list. When enabled, in the Grid View inactive site cards will appear greyed out, and in the List View they will appear with a transparent blue color over the entire row. When disabled, inactive sites will not be included in the list.
The Sort sites by button can be used to sort the site list. When the button is clicked, a list is displayed with the available sorting options, with an arrow indicating which method is currently applied. The list can be sorted by:
• site name
• the tenants to which the sites are assigned
• tags that have been assigned to the sites
• the number of alarms triggered for a site
• the voltage value reported on the site card
• the date that data was ingesteds
The Ascending/Descending button can be used to control the order in which the site list is sorted, based on the selected sort option. The list can be sorted in either ascending order, or descending order.
• For site names, tenant names and tags, this is alphabetical with ascending as A-Z and descending as Z-A.
• For alarms and voltage, this is numerical with ascending as least to least to greatest and descending as greatest to least.
• For push dates, this based on date and time with ascending as oldest to most recent and descending being most recent to oldest.
The See Notifications tool at the top of the page will receive a notification by default each time a new site is added.
Tools for interacting with the sites are also provided, but how they are accessed differs based on the format of the list. Each format and the tools available is explained below.
Grid View
The Grid View displays the available sites as a grid of site cards, with a site card representing each site. Each site card has two modes of displaying information and action buttons:
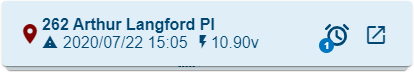
• In the default state, each site card displays the following:
• The site name.
• The site icon identifying the tenant the site is assigned to (at the left of the site name). Hovering the cursor over the icon will display the tenant name and the icon is displayed with the color assigned to that tenant. See Tenants for information on this setting.
• The timestamp of when data was last received from the site. If the elapsed time exceeds the Data Last Received Threshold defined for the site, the clock symbol besides the timestamp changes to a warning symbol. Hovering the cursor over this symbol will display the tooltip "Site is not receiving data.".
• The last received voltage data values from datasets in the site with the name 'Input Voltage'.
• All tags that have been assigned to the site.
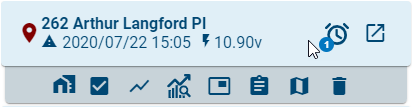
• Two possible action buttons described in the table below.
• An Options button that provides a menu of additional commands, explained in the table below.
• When the cursor is hovered over the site card, additional action buttons appear below the card, as shown in the image below. These buttons are also described in the table below.
Expand each section by clicking the arrow at the end of each heading.
Events Triggered
View the details of an event that has been created for an alarm being triggered for the selected site. This button is only present when an alarm has been triggered.
1. Click the Events Triggered button in the site card.
The information page for the site is displayed with the Events tab selected. This tab lists the details of any events that have been created for the site. Once all events for the site have been acknowledged, the icon will be removed from the site card. Events can be acknowledged through a site gadget on the dashboard or from the Events tab of a Site Information page. See Dashboards and Site Information for more information.
Go to Site
Open a separate page with detailed information about the selected site.
1. Click the Go to Site button in the site card.
The site page for the sensor is displayed. See Site Information for more information about this page.
Options
Display a menu that provides the same commands available when hovering over the site card.
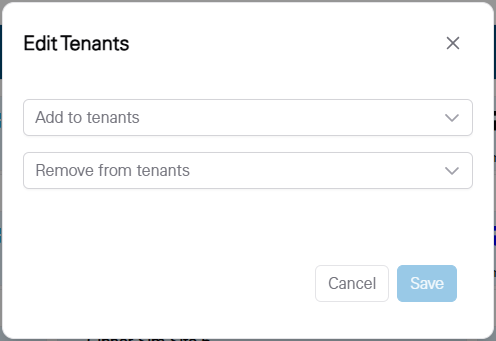
Edit Tenants
Add or remove tenants to which the site is assigned. Only users in the assigned tenants can access the site.
1. Click the Edit Tenants button.
The Edit Tenants dialog box is displayed.
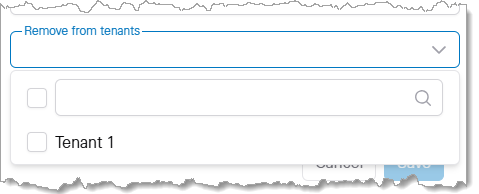
Clicking the Add to tenants field will display a drop-down list of tenants to which the site can be assigned. Clicking the Remove from tenants field will display a drop-down list of tenants to which the site is already assigned. A search field at the top of each list can be used to filter the list of tenants to only those with a name that matches at least part of the text entered.
The check box beside the search field can be used to select/deselect all tenants in the list.
2. Click the check box beside the desired tenant(s) in the relevant list to either add or remove the site to/from the selected tenant(s).
3. Click Save.
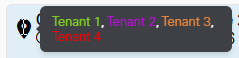
The tenants to which the site is assigned is updated. The color of the tenant icon on the site card will be updated based on the selected tenant. If multiple tenants are assigned, the icon will be black. If no tenant is assigned, the icon will be blue. Hovering over the icon will display a tooltip with the name(s) of the tenant(s) assigned, in the colors associated with each tenant.
This option is only available if the Tenants functionality has been enabled on the Settings page and if the site count limit for the new tenant has not been reached. Also, this option is only available when logged in as a System Administrator user. See Settings for more information about this option.
Activate/Deactivate
Activate or deactivate the current site. If the site is currently active, clicking the check box will deactivate the site. If the site is currently deactivated, clicking the check box will activate the site. Deactivated sites will not display in the site list unless the Include Inactive Sites option is enabled. Sites can be deactivated when they are not being used.
1. Click the Activate/Deactivate check box in the site card.
If the site is being deactivated, a message will be displayed to confirm the deactivation.
2. Click Yes to deactivate the site, if a confirmation is displayed.
The state of the site will be changed accordingly and the display in the site list updated.
Data ingested into an inactive site will not be stored in Cipher.
Sites cannot be activated if the active site count limit for the tenant or the Flowlink Cipher license has been reached. Attempting to activate a site when the site count limits have been reached will display an error message.
Also, sites in the Holding Tank cannot be re-activated until they have been transferred out of the Holding Tank into another tenant.See Settings for information on tenants and the Holding Tank.
Level, Velocity and Flow Rate from Site
Create a graph of level, velocity and flow rate data from the selected site using the default public template named Level, Velocity, Flow Rate template, which is found in the Graph Templates screen.
1. Click the Level, Flow and Velocity from Site button in the site card.
The Create New Graph screen is displayed. If the selected site has level, flow and velocity datasets, then the graph is populated for preview, otherwise a message will be displayed identifying the missing dataset(s). By default, the graph will be populated with the first dataset in the Datasets list on the Devices tab of the site information page for the selected site. The order of the list can be adjusted if needed. See Configure Graph for information on creating the graph and Devices Tab for information the dataset list.
Graph from Site
Create a new graph from datasets from the site.
1. Click the Graph from Site button in the site card.
The Create New Graph screen is displayed. See Configure Graph for information on creating graphs.
Graph from Template
Create a new graph of datasets from the site using an existing graph template.
1. Click the Graph from Template button in the site card.
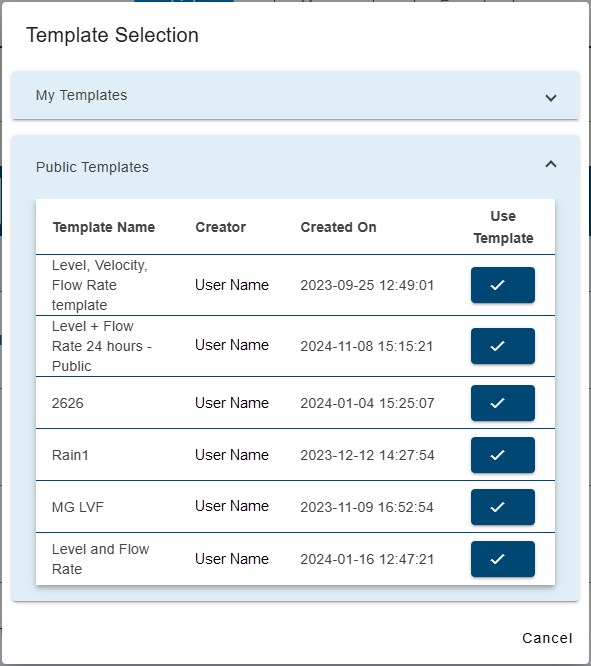
The Template Selection dialog box is displayed.
This dialog box contains all templates available for use. This includes templates created by the current user, as well as templates created and shared by other users.
2. Click the Use Template button for the desired template.
The Create New Graph screen is displayed populated according to the selected template. See Configure Graph for information on creating graphs.
Compute Datasets from Site
Compute a dataset using data from the selected site.
1. Click the Compute Datasets from Site button in the site card.
The Compute Datasets page is displayed. See Compute Datasets for information on computing a dataset.
See on Map
View the location of the site in the Map page.
1. Click the See on Map button in the site card.
The Map screen is displayed. The map is centered on the sensor location.
2. To zoom into or out of the map, click the Zoom buttons.
3. Click Listto go back to the List view of the Sites page.
If coordinates have not been set for the site, this button is disabled.
Delete Site
Delete the selected site, removing it from Cipher and all site-selection controls. The System Administrator, Administrator or Site Manager role is required to delete a site.
When a site is deleted, the following items related to the site are also removed from Cipher:
• Devices and their datasets
• Computed datasets
• Alarm settings
• Events on the Alarm screen
Attempting to open a graph that contains a dataset from a deleted site will display a message stating that the graph source data has been deleted.
Once a site and its data has been deleted, it cannot be recovered.
1. Click the Delete Site button in the site card.
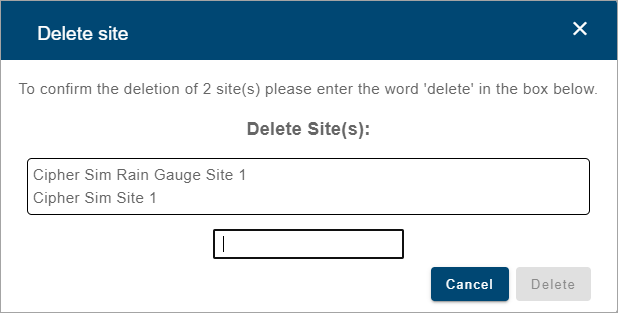
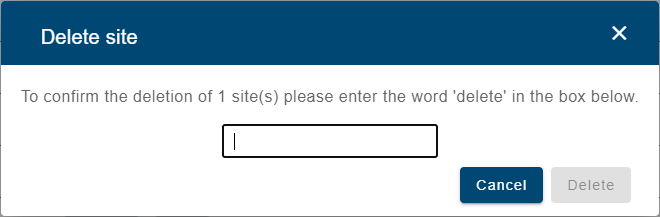
A message is displayed asking to proceed with the deletion. This message will state the number of sites being deleted (which is 1 when in Grid View) and the name of that site. The word "Delete" must be typed in the field provided in order to complete the deletion. This field is not case sensitive, both upper and lower case letters will be recognized. These features are in place to ensure that sites are not deleted accidentally.
2. Type Delete in the field.
3. Click Delete.
The site is deleted and a message is displayed confirming the deletion.
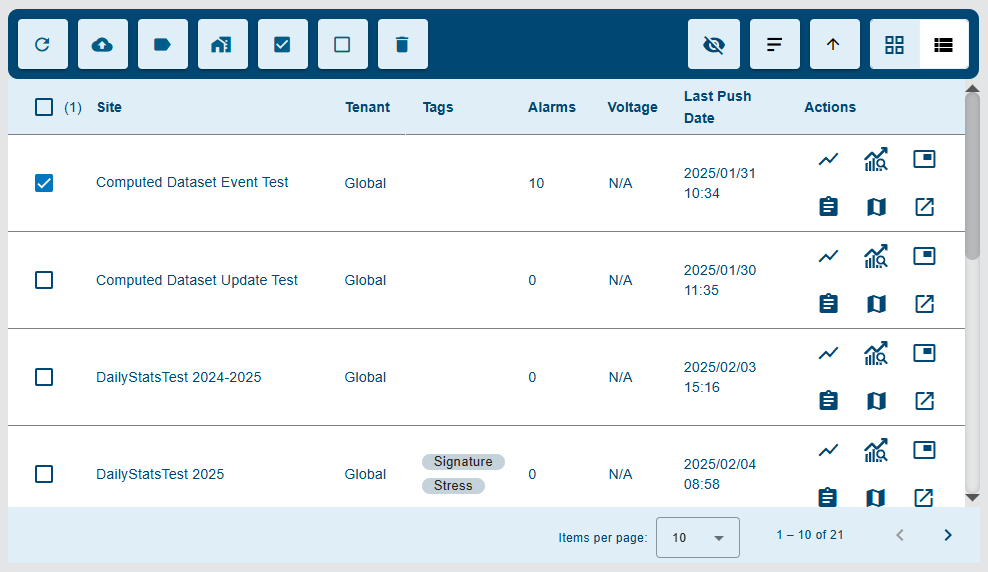
List View
The List View displays the available sites in the form of a table, with a separate row for each site.
The following information is provided in the table for each site:
• The site name.
• The name of the tenant(s) the site is assigned to, displayed in the color assigned to each tenant in Settings. See Tenants for information on this setting.
• Any tags assigned to the site.
• The number of alarms currently active for the site.
• The last received voltage data values from datasets in the site with the name 'Input Voltage'
• The timestamp of when data was last received from the site.
The table displays a maximum of 10 sites by default. This limit can be changed using the Items per page control below the table. Navigation options also appear below the table when the number of sites exceeds the set limit and more pages are needed. This control reports the total number of sites in the complete table and the number of sites in the current page of the table.
Various tools are available for interacting with the sites in the list, with some provided in the Actions column of the table and others in the toolbar above the table. To use the tools provided in the toolbar, the relevant site must be selected in the table using the check box at the beginning of the row. Multiple sites can be selected if desired, or the check box in the heading row of the table can be used to select/deselect all sites at once. The number of selected sites is displayed in brackets beside the check box in the heading row. When tools are used with multiple sites selected, the changes made will be applied to all selected sites. Each of the available tools are described in the table below.
Tool
Description
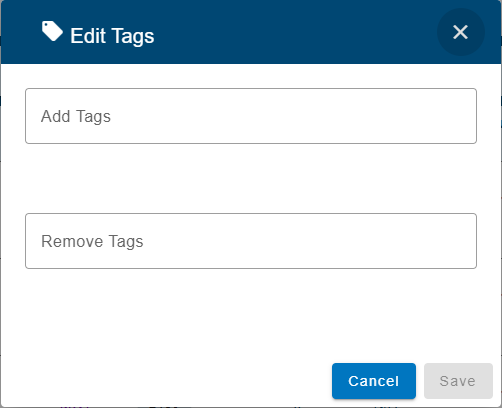
Edit Tags
Change the tags assigned to the selected site(s).
1. Select the relevant site.
2. Click the Edit Tags button.
The Edit Tags dialog box is displayed.
3. Click in the Add Tags field to display a list of available tags.
4. Click the tag in the list that is to be assigned to the site.
The selected tag is added to the Add Tags field. An X button on each tag can be used to remove a tag if it was selected by accident. A Remove All button is also provided to remove all tags selected to be added, if needed.
If tags have already been assigned to the site, this dialog box can also be used to remove them.
5. Click in the Remove Tags field to display a list of tags that have been assigned to the site.
6. Click the tag in the list that is to be removed.
The tag will be added to the Remove Tags field.
7. Click Save to apply the changes.
The dialog box is closed and any tags in the Add Tags field are assigned to the site, while any in the Remove Tags field are removed from the site. All tags assigned to the site will be displayed on the site card when sites are displayed using the Grid view.
Note: This function can also be used when viewing site cards in the Grid View as long as a site is selected in the List View.
Edit Tenants
Add or remove tenants to which the site is assigned. Only users in the assigned tenants can access the site.
1. Click the Edit Tenants button.
The Edit Tenants dialog box is displayed.
Clicking the Add to tenants field will display a drop-down list of tenants to which the site can be assigned. Clicking the Remove from tenants field will display a drop-down list of tenants to which the site is already assigned. A search field at the top of each list can be used to filter the list of tenants to only those with a name that matches at least part of the text entered.
The check box beside the search field can be used to select/deselect all tenants in the list.
2. Click the check box beside the desired tenant(s) in the relevant list to either add or remove the site to/from the selected tenant(s).
3. Click Save.
The tenants to which the site is assigned is updated. The color of the tenant icon on the site card will be updated based on the selected tenant. If multiple tenants are assigned, the icon will be black. If no tenant is assigned, the icon will be blue. Hovering over the icon will display a tooltip with the name(s) of the tenant(s) assigned, in the colors associated with each tenant.
This option is only available if the Tenants functionality has been enabled on the Settings page and if the site count limit for the new tenant has not been reached. Also, this option is only available when logged in as a System Administrator user. See Settings for more information about this option.
Activate/Deactivate
Activate or deactivate the selected site. The current state of the selected site will be indicated by the button that is populated with a check mark. Deactivated sites will not display in the site list unless the Show Inactive Sites option is enabled. Sites can be deactivated when they are not being used.
1. Select the relevant site.
2. Click the Activate/Deactivate button.
If the site is being deactivated, a message will be displayed to confirm the deactivation.
3. Click Yes to deactivate the site, if a confirmation is displayed.
The state of the site will be changed accordingly and the display in the site list updated.
Data ingested into an inactive site will not be stored in Cipher.
Sites cannot be activated if the active site count limit for the tenant or the Flowlink Cipher license has been reached. Attempting to activate a site when the site count limits have been reached will display an error message.
Also, sites in the Holding Tank cannot be re-activated until they have been transferred out of the Holding Tank and into another tenant.See Settings for information on tenants and the Holding Tank.
Delete Site
Delete the selected site, removing it from Cipher and all site-selection controls. The System Administrator, Administrator or Site Manager role is required to delete a site.
When a site is deleted, the following items related to the site are also removed from Cipher:
• Devices and their datasets
• Computed datasets
• Alarm settings
• Events on the Alarm screen
Attempting to open a graph that contains a dataset from a deleted site will display a message stating that the graph source data has been deleted.
Once a site and its data has been deleted, it cannot be recovered.
1. Click the Delete Site button in the Actions column.
A message is displayed asking to proceed with the deletion. If multiple sites were selected, the number of sites to be deleted will be included in the message, along with the names of the sites to be deleted. The word "Delete" must be typed in the field provided in order to complete the deletion. The field is not case sensitive, both upper and lower case letters will be recognized. These features are in place to ensure that sites are not deleted accidentally.
2. Type Delete in the field.
3. Click Delete.
The selected sites are deleted and a message is displayed for each site confirming the deletion.
Level, Flow and Velocity from Site
Create a graph of level, flow and velocity data from the selected site using the default public template named Level, Velocity, Flow Rate template, which is found in the Public Templates table of the Graph Templates screen.
1. Click the Level, Flow and Velocity from Site button in the Actions column.
The Create New Graph screen is displayed. If the selected site has level, flow and velocity datasets, then the graph is populated for preview, otherwise a message will be displayed identifying the missing dataset(s). By default, the graph will be populated with the first dataset in the Datasets list on the Devices tab of the site information page for the selected site. The order of the list can be adjusted if needed. See Configure Graph for information on creating the graph and Devices Tab for information the dataset list.
Graph from Site
Create a new graph from datasets from the site.
1. Click the Graph from Site button in the Actions column.
The Create New Graph screen is displayed. See Configure Graph for information on creating graphs.
Graph Site from Template
Create a new graph of datasets from the site using an existing graph template.
1. Click the Graph Sitefrom Template button in the Actions column.
The Template Selection dialog box is displayed.
This dialog box contains all templates available for use. This includes templates created by the current user, as well as templates created and shared by other users.
2. Click the Use Template button for the desired template.
The Create New Graph screen is displayed populated according to the selected template. See Configure Graph for information on creating graphs.
Compute Datasets from Site
Compute a dataset using data from the selected site.
1. Click the Compute Datasets from Site button in the Actions column.
The Compute Datasets page is displayed. See Compute Datasets for information on computing a dataset.
See on Map
View the location of the site in the Map page.
1. Click the See on Map button in the Actions column.
The Map screen is displayed. The map is centered on the sensor location.
2. To zoom into or out of the map, click the Zoom buttons.
3. Click Listto go back to the List view of the Sites page.
 which function as a toggle. Each view provides access to information for the sensors at a site location.
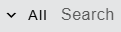


 is also provided to remove all tags selected to be added, if needed.