• Click the  button in the top-left corner of the map.
The Map page displays a map of all accessible site locations. The map is sourced by OpenStreetMap. The area of the map displayed on the screen can be change by zooming and panning the display.
1. To zoom into the map, do any of the following:
• Click the button in the top-left corner of the map.
• Double-click the mouse.
• Rotate the middle mouse wheel forward.
2. To zoom out, do either of the following:
• Click the  icon in the top-left corner of the map.
• Rotate the middle mouse wheel in reverse.
3. To pan the map, press and hold the mouse button and move the mouse.
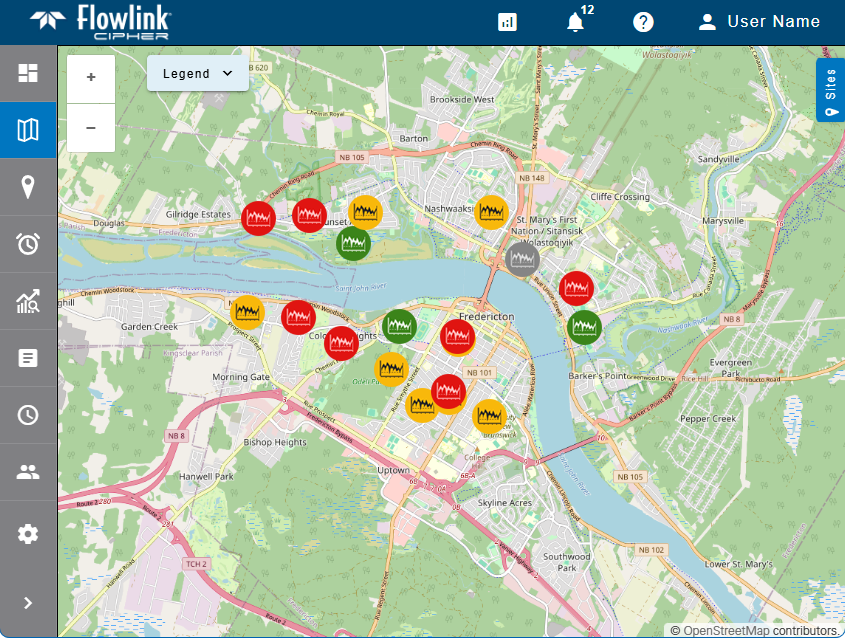
On the right side of the map is a Sites button  . This can be used to expand/collapse the Sites panel, which contains a list of all sites accessible to the current user. If the list contains inactive sites, these will be displayed with faded colors to help distinguish inactive sites from active sites.
If the user has been assigned to a tenant, the list will only contain the sites in that tenant. Similarly, if Preferred Tags have been specified in the Preferences tab of the current user profile, the list will display a "Tags applied" indicator and only sites assigned those tags will be included in the list. If the "Show inactive sites..." option has not been enabled in the Preferences tab, only active sites will be available. See Preferences for more information on these options.
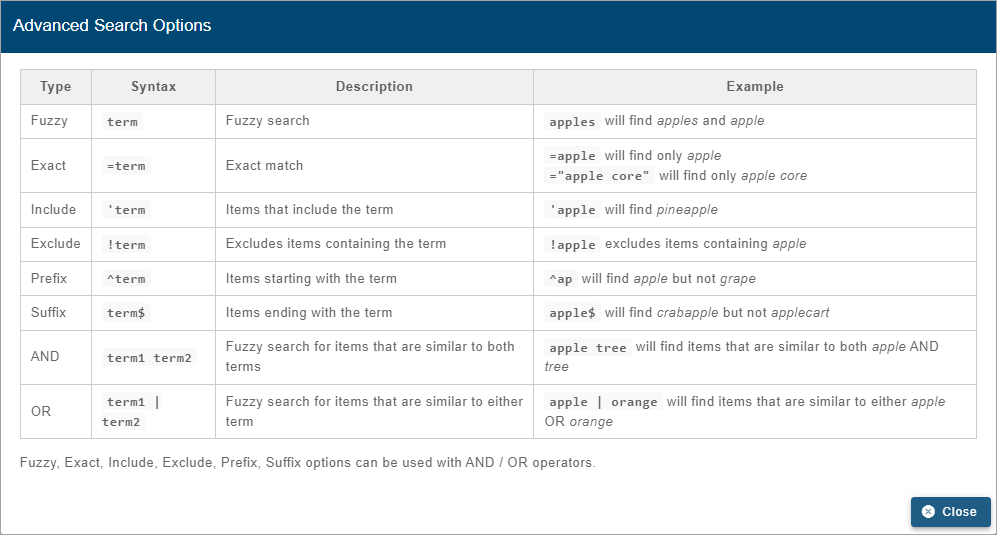
The list of sites can be filtered by entering text in the Search field at the top of the panel. Only sites that match the text specified will be included in the list. Advanced Search characters can also be specified with the text to perform different types of searches, some more specific, some more general. Clicking the Advanced Search Options link below the Search field will display a chart of the possible search types and how to use them. The AND/OR operators can also be used in combination with the other Advanced Search options if needed.
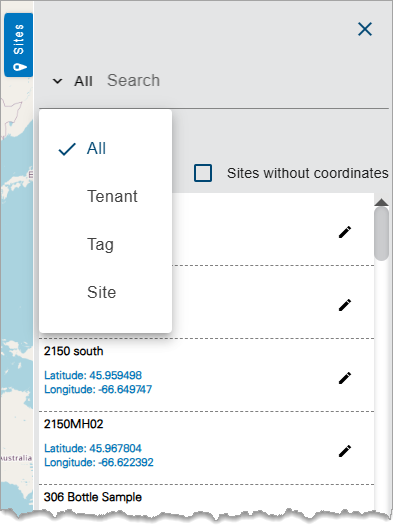
A drop-down list beside the Search field can be used to filter the list even further by specifying the property in which to search for the matching text. Also, when a property is selected from the drop-down list, clicking in the Search field will display a drop-down list of possible values based on the selected property, allowing a value to be selected instead of entering it manually. When an option is selected, only sites with text in the selected property (tag, site, etc.) will be available.
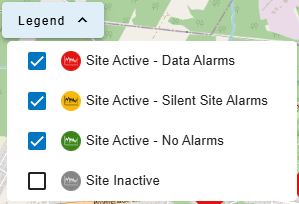
Each site is represented by an icon on the map. The color of the icon indicates the status of the site:
• Red: The site is active and has a data alarm.
• Yellow: The site is active and has a silent-site alarm.
• Green: The site is active and has no alarms.
• Grey: The site is inactive.
A legend identifying the meaning of each symbol color can be displayed by clicking the Legend button  in the top-left corner of the map. When expanded, the legend can be used to filter the display of site symbols on the Map page by selecting or deselecting the check box for each colour. This will also filter the sites displayed in the Sites panel. Only the site symbol types selected in the legend will be displayed in the map and the Sites panel. For example, if the Site Inactive option is not selected, symbols representing inactive sites will not be displayed and inactive sites will not be displayed in the Sites panel. This choice is remembered each time the application is opened.
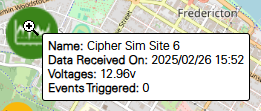
Hovering the mouse cursor over a site symbol will display a tooltip with information about the site, including:
• the name of the site
• the timestamp of the last received data
• the voltage of the device at the site
• the number of active events for the site
• a control to display a site gadget populated with graph data for the selected site
Clicking a site either on the map or in the Sites panel will zoom and recenter the map on the location of that site. Selecting a site will also populate the top portion of the Sites panel with information about the selected site and tools for interacting with the site. Expand each section in the table below to view a description of each tool.
| Level, Flow and Velocity from Site Create a graph of level, flow and velocity data from the selected site using a default template. 1. Click the Level, Flow and Velocity from Site button in the site card. The Create New Graph screen is displayed. If the selected site has level, flow and velocity datasets, then the graph is populated for preview, otherwise a message will be displayed identifying the missing dataset(s). See Configure Graph for information on creating graphs. |
| Graph from Site Create a new graph from datasets from the site. 1. Click the Graph from Site button in the site card. The Create New Graph screen is displayed. See Configure Graph for information on creating graphs. |
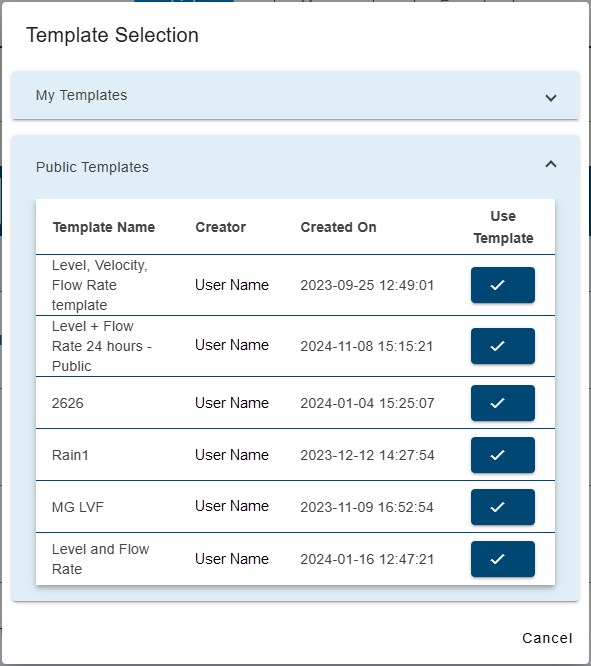
| Graph Site from Template Create a new graph of datasets from the site using an existing graph template. 1. Click the Graph Site from Template button in the site card. The Template Selection dialog box is displayed.
This dialog box contains two drop-down lists, one for templates created by the current user and one for public templates created and shared by another user. 2. Expand the My Templates or Public Templates list. 3. Click the Use Template button for the desired template. The Create New Graph screen is displayed populated according to the selected template. See Configure Graph for information on creating graphs. |
| Compute Datasets from Site Compute a dataset using data from the selected site. 1. Click the Compute Datasets from Site button in the site card. The Compute Datasets page is displayed. See Compute Datasets for information on computing a dataset. |
| Go to Site View detailed information about the selected site. 1. Click the Go to Site button in the site card. The site page for the sensor is displayed. See Site Information for more information about this page. |
The Sites panel also contains With coordinates and Without coordinates check boxes. These options can be used to filter the list to show only sites that do have coordinates specified or sites that do not have coordinates specified. If there are sites that are missing their coordinate values, it is not possible for those sites to be displayed on the map.
The Edit button beside each site in the Sites panel can be used to specify or update coordinates for a site. Only users with the Editor role have the necessary permissions to change site locations. To specify coordinates for a site:
1. Select the relevant site icon on the map or expand the Sites panel.
2. Click the Edit button  for the relevant site.
Latitude and Longitude fields are added to the Sites panel. The new coordinates can either be entered in these fields or selected by clicking on the map while the site is in Edit mode.
Note the change in the cursor when hovering over the map when a site is in Edit mode.
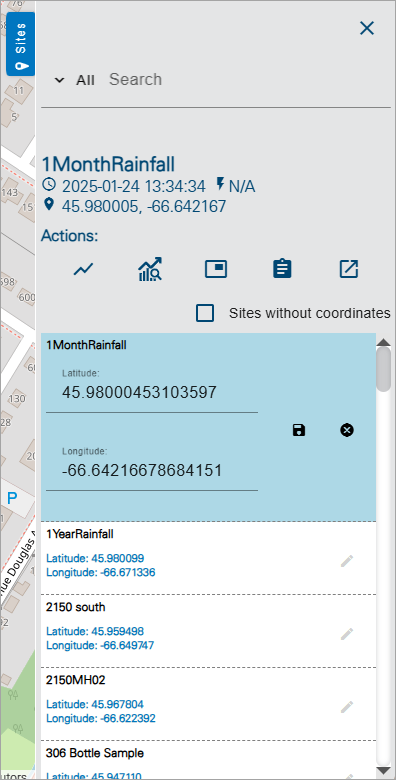
3. Select/Enter the new coordinates for the site.
4. Click the Save button for the site in the Sites panel.
The location of the site is updated.
Related topics:
• Sites